Advanced Report Overview
This page provides an orientation to the Advanced Report available within Dr Mi6Rate. This report gives you a deep view of your environment to support decision-making, using the most recent application mappings, server additions, treatment plans, and wave strategies.
Side Menu Overview
Side Menu Overview
The left-hand sidebar is used to navigate across sections of the report:
- Executive Summary
High-level stats, migration readiness metrics, and key progress indicators. - Inventory (formerly Discover)
Drill-down views of collected server and application data. - Dependencies
Visualise app-to-app and server-to-server network communications. - SQL Insights
SQL Server performance, configuration, and consolidation insights. - Insights
Highlights anomalies, outliers, and optimization opportunities. - Settings / Help (coming soon)
Quick access to this documentation and contextual help based on the page.
Executive Summary
The Executive Summary is designed to give senior stakeholders and technical leads an instant snapshot of pro6Ress and risk.
It includes:
- Total discovered servers and applications
- % Mapped vs Unmapped
- 6R Readiness (Ready, Blocked, Conditions)
- OS and platform breakdowns
- Support status across OS versions
- Utilization signals (CPU, RAM, Storage)
Navigating the Inventory Section
The Inventory view (previously named “Discover”) is your main workspace for investigating discovered resources.
Filter by Application

- Use the app filter at the top of the screen.
- This will automatically scope the entire view (Servers, Tiers, Tags, etc.)
- Combine with Environment and Server filters for more precision.
Use Tags Effectively
Tags allow you to label and filter applications and servers using custom business or technical logic.
- Common tags include:
Wave 1,Windows 2012,Critical App,Vendor: Oracle. - Tags are visible in the filter menu and on relevant columns.
Key Tabs and Concepts
This section gives a high-level overview of each of the main Advanced Report tabs.
Digital Estate
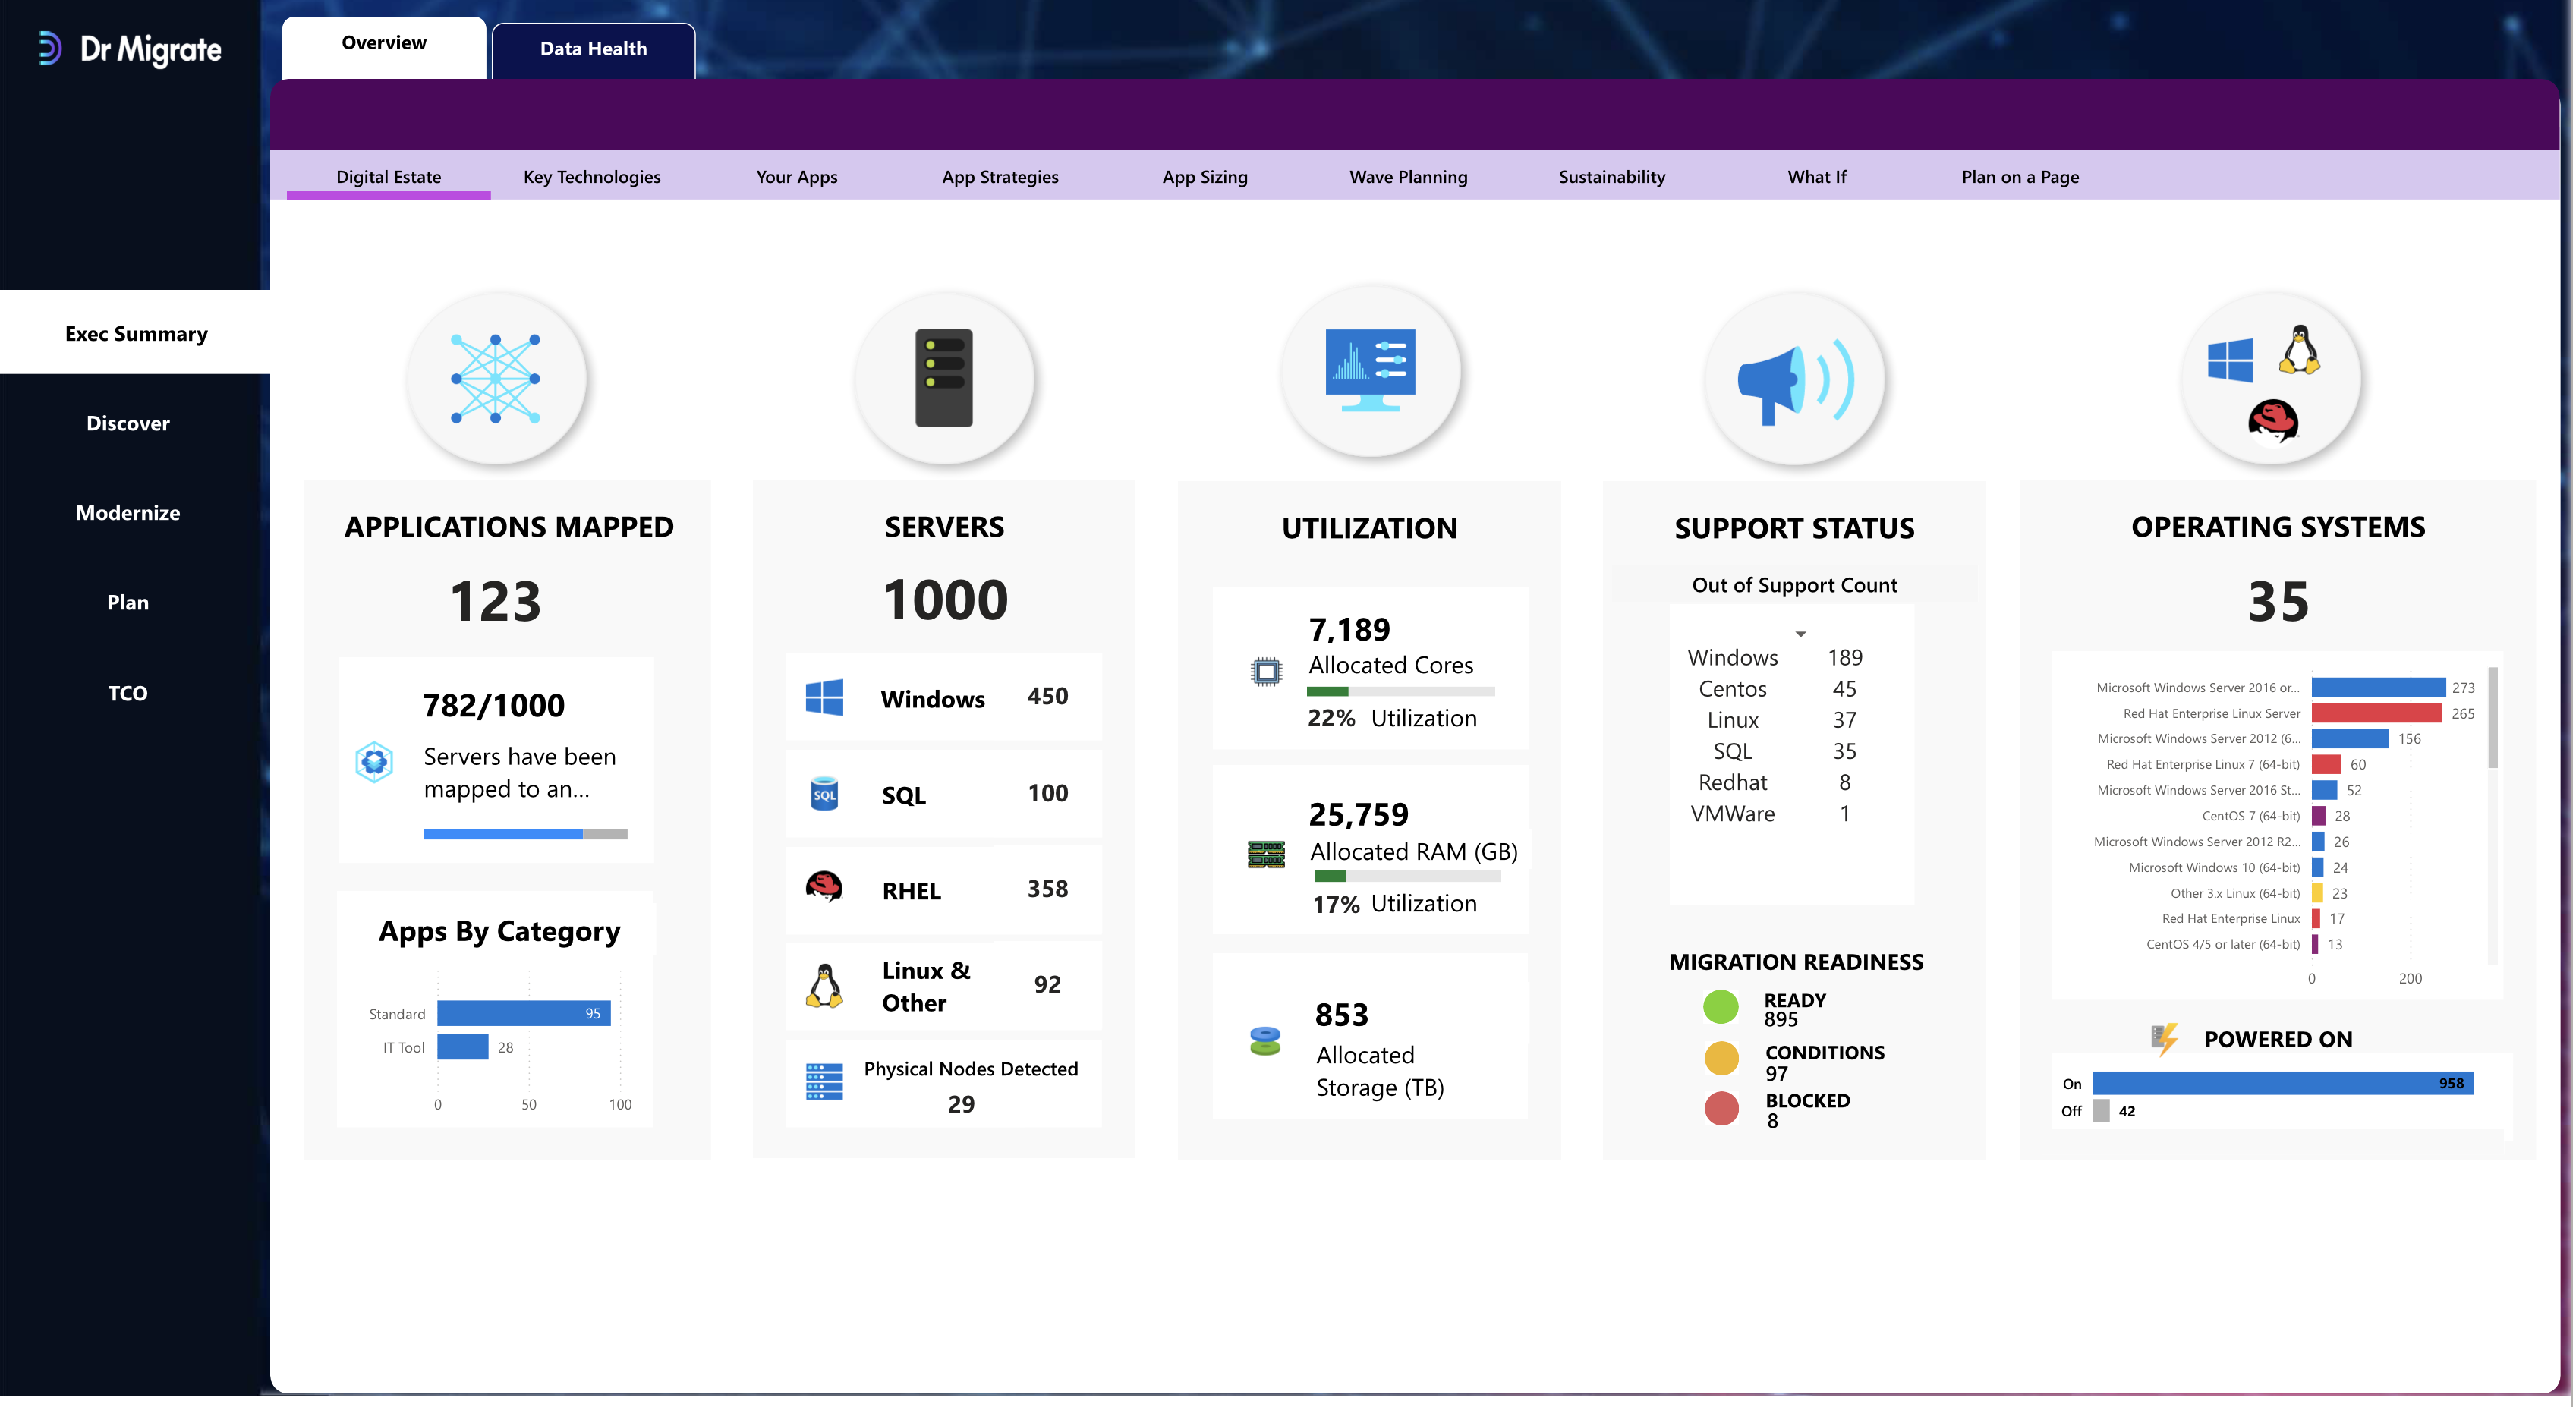
A high-level summary of infrastructure components:
- Total apps and servers
- OS platforms and their support status
- CPU/RAM/Storage utilization bands
- Power state (on/off)
- Mapped vs Unmapped status
Key Technologies
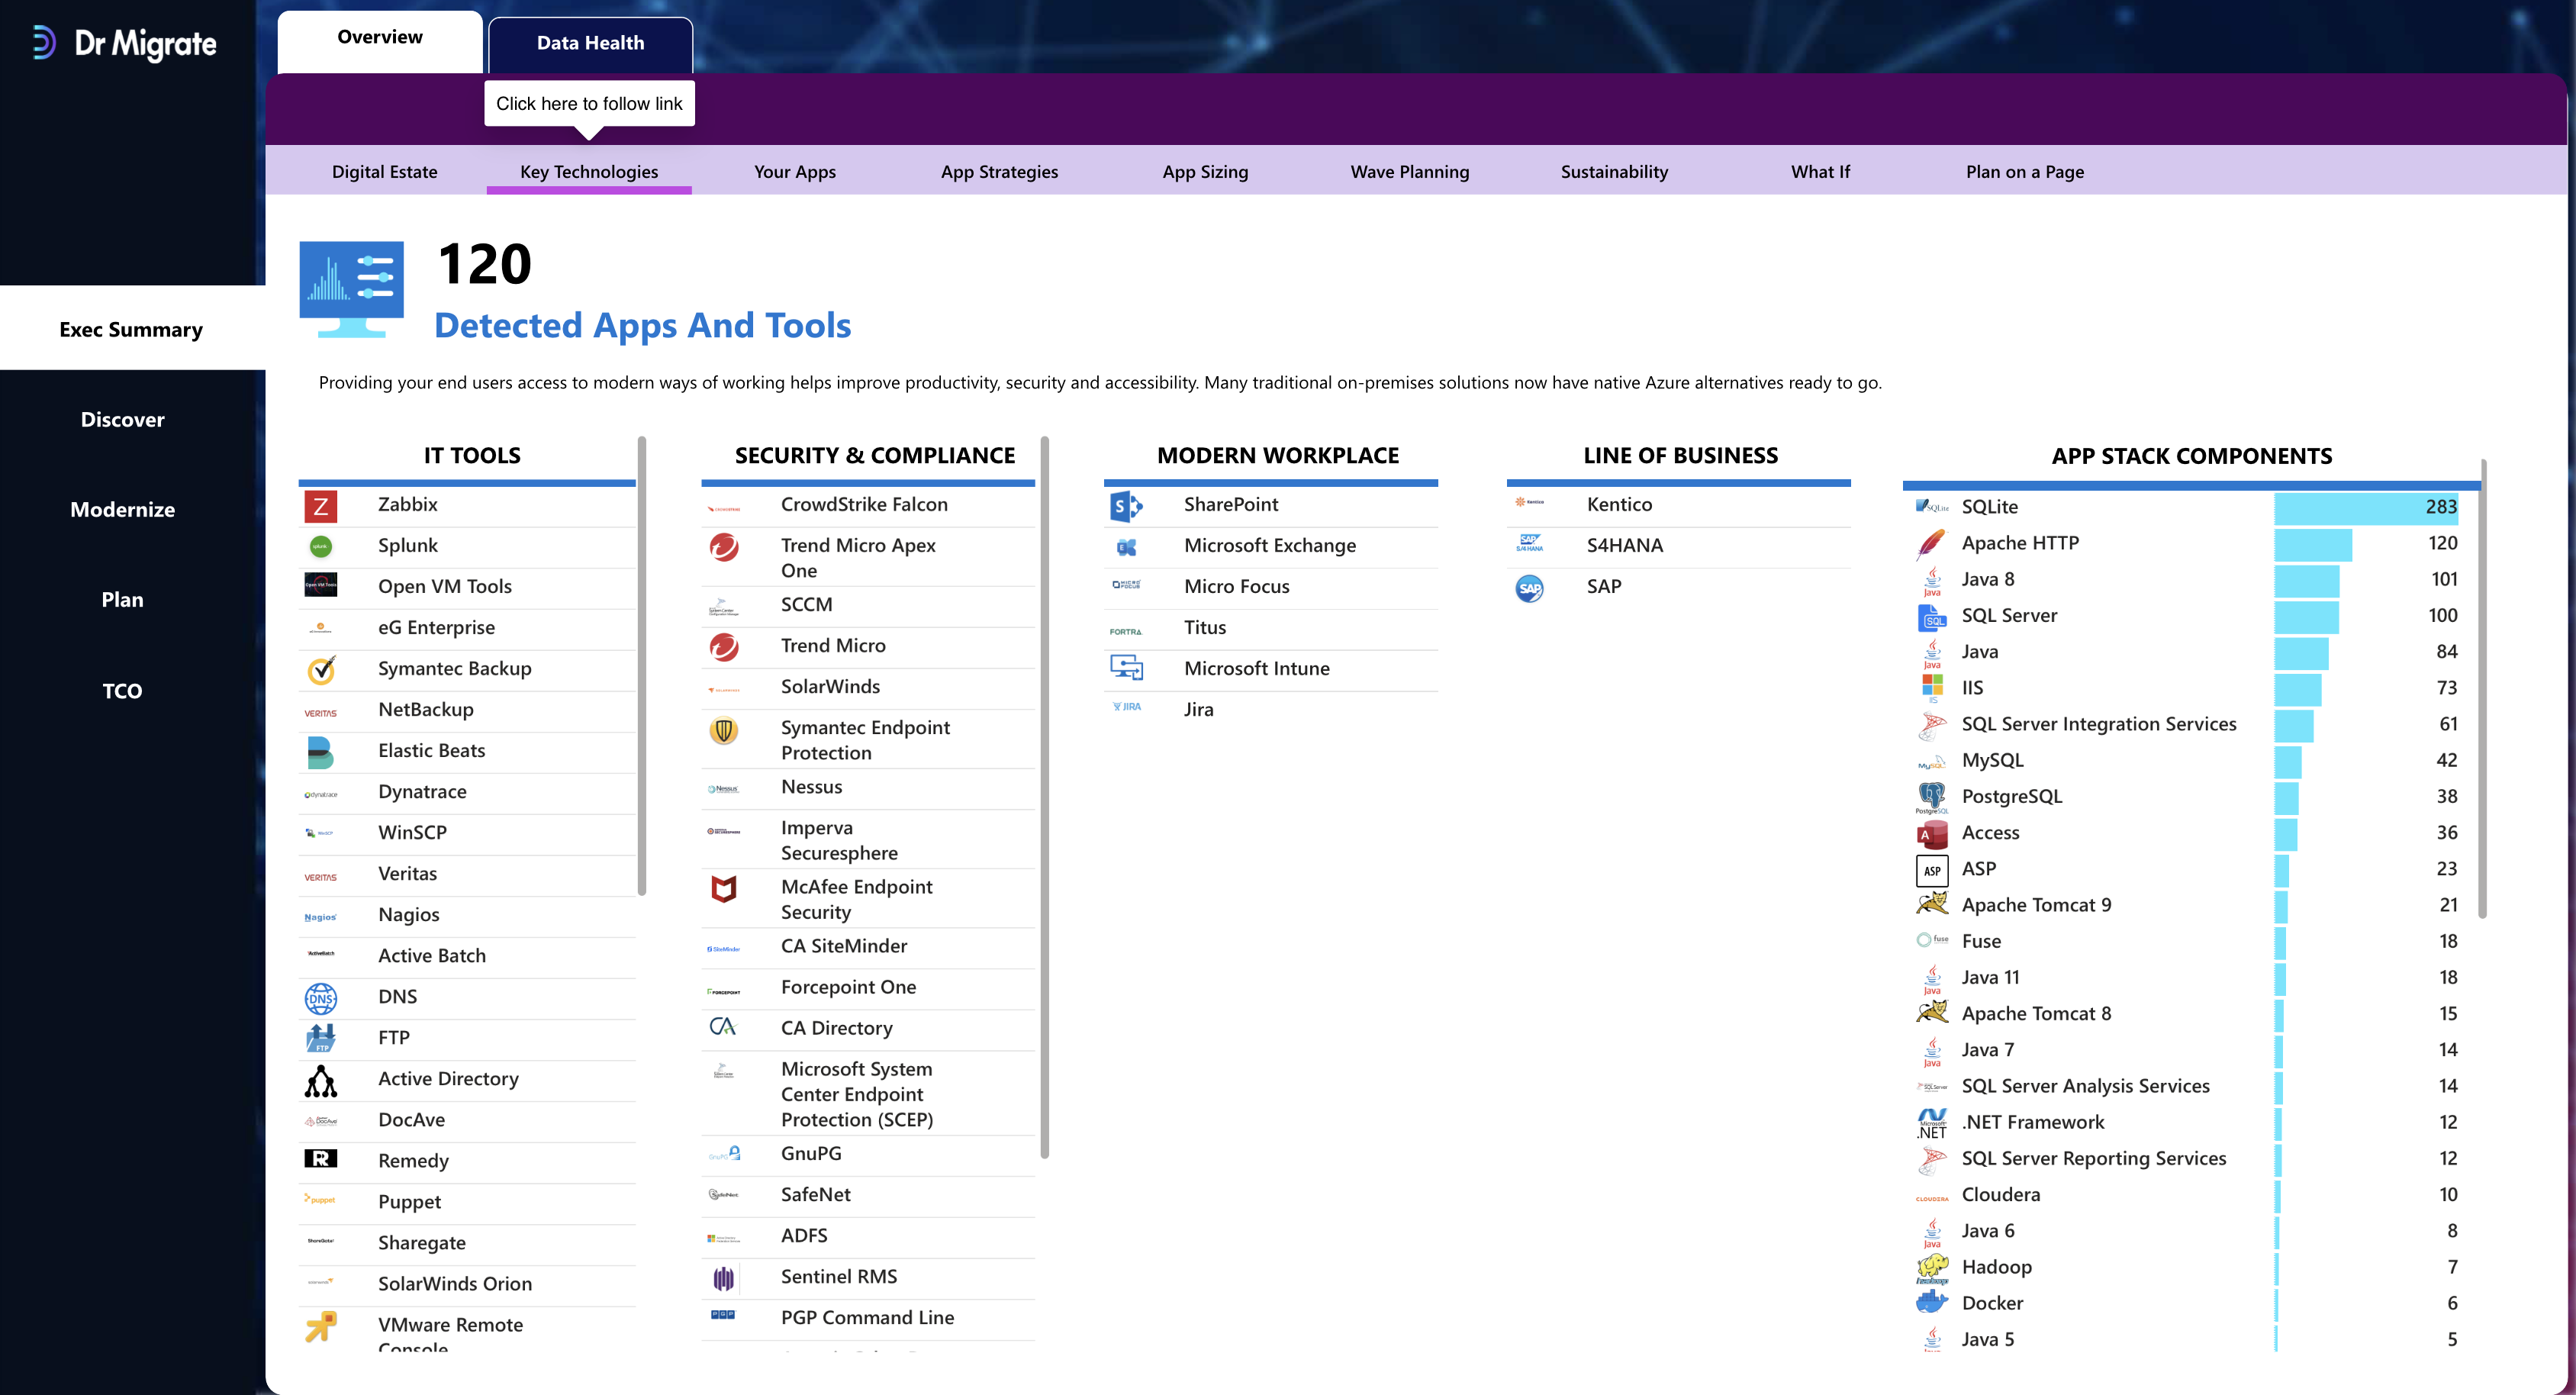
Breaks down detected IT tooling and app-level components across your estate. Includes:
- Monitoring (e.g. Zabbix, SolarWinds)
- Endpoint protection (e.g. CrowdStrike, Defender)
- SQL, Apache, Java, IIS, BizTalk, and others
Your Apps
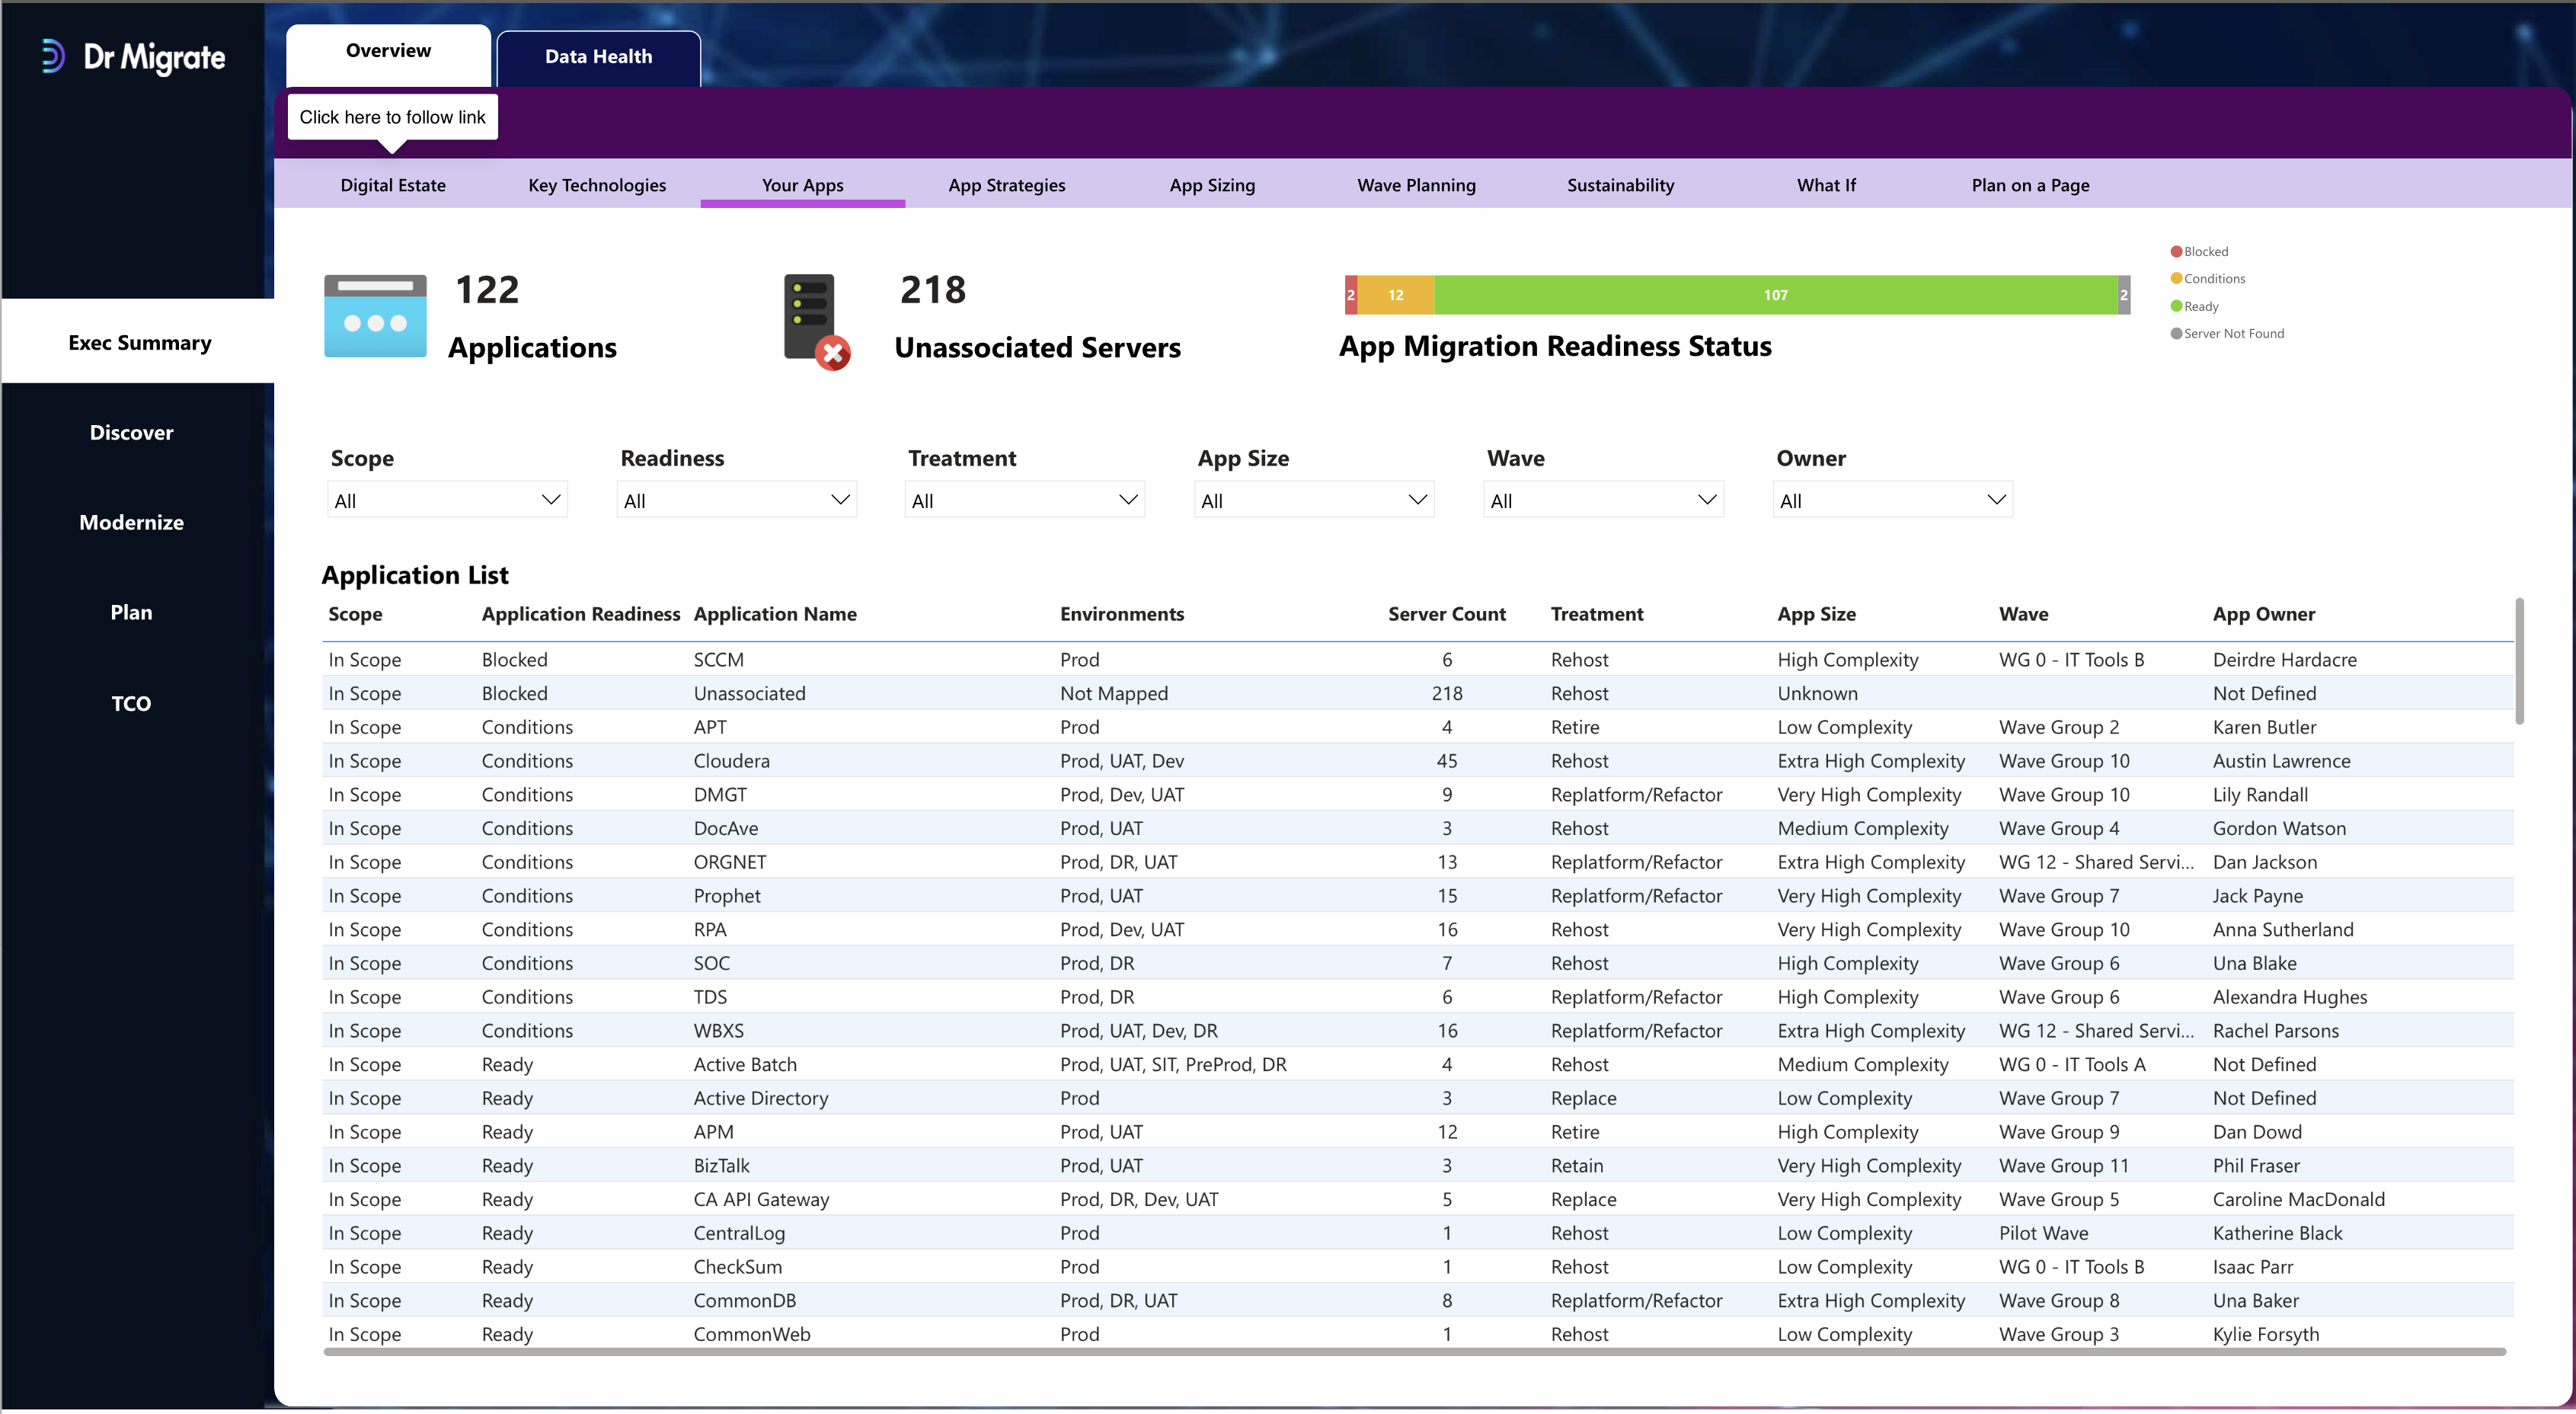
Displays all discovered applications with associated metadata:
- App Name
- Readiness State (Ready, Blocked, Conditions)
- Treatment Strategy (Rehost, Retain, etc.)
- Complexity Score
- Assigned Owner
- Wave Assignment
App Strategies
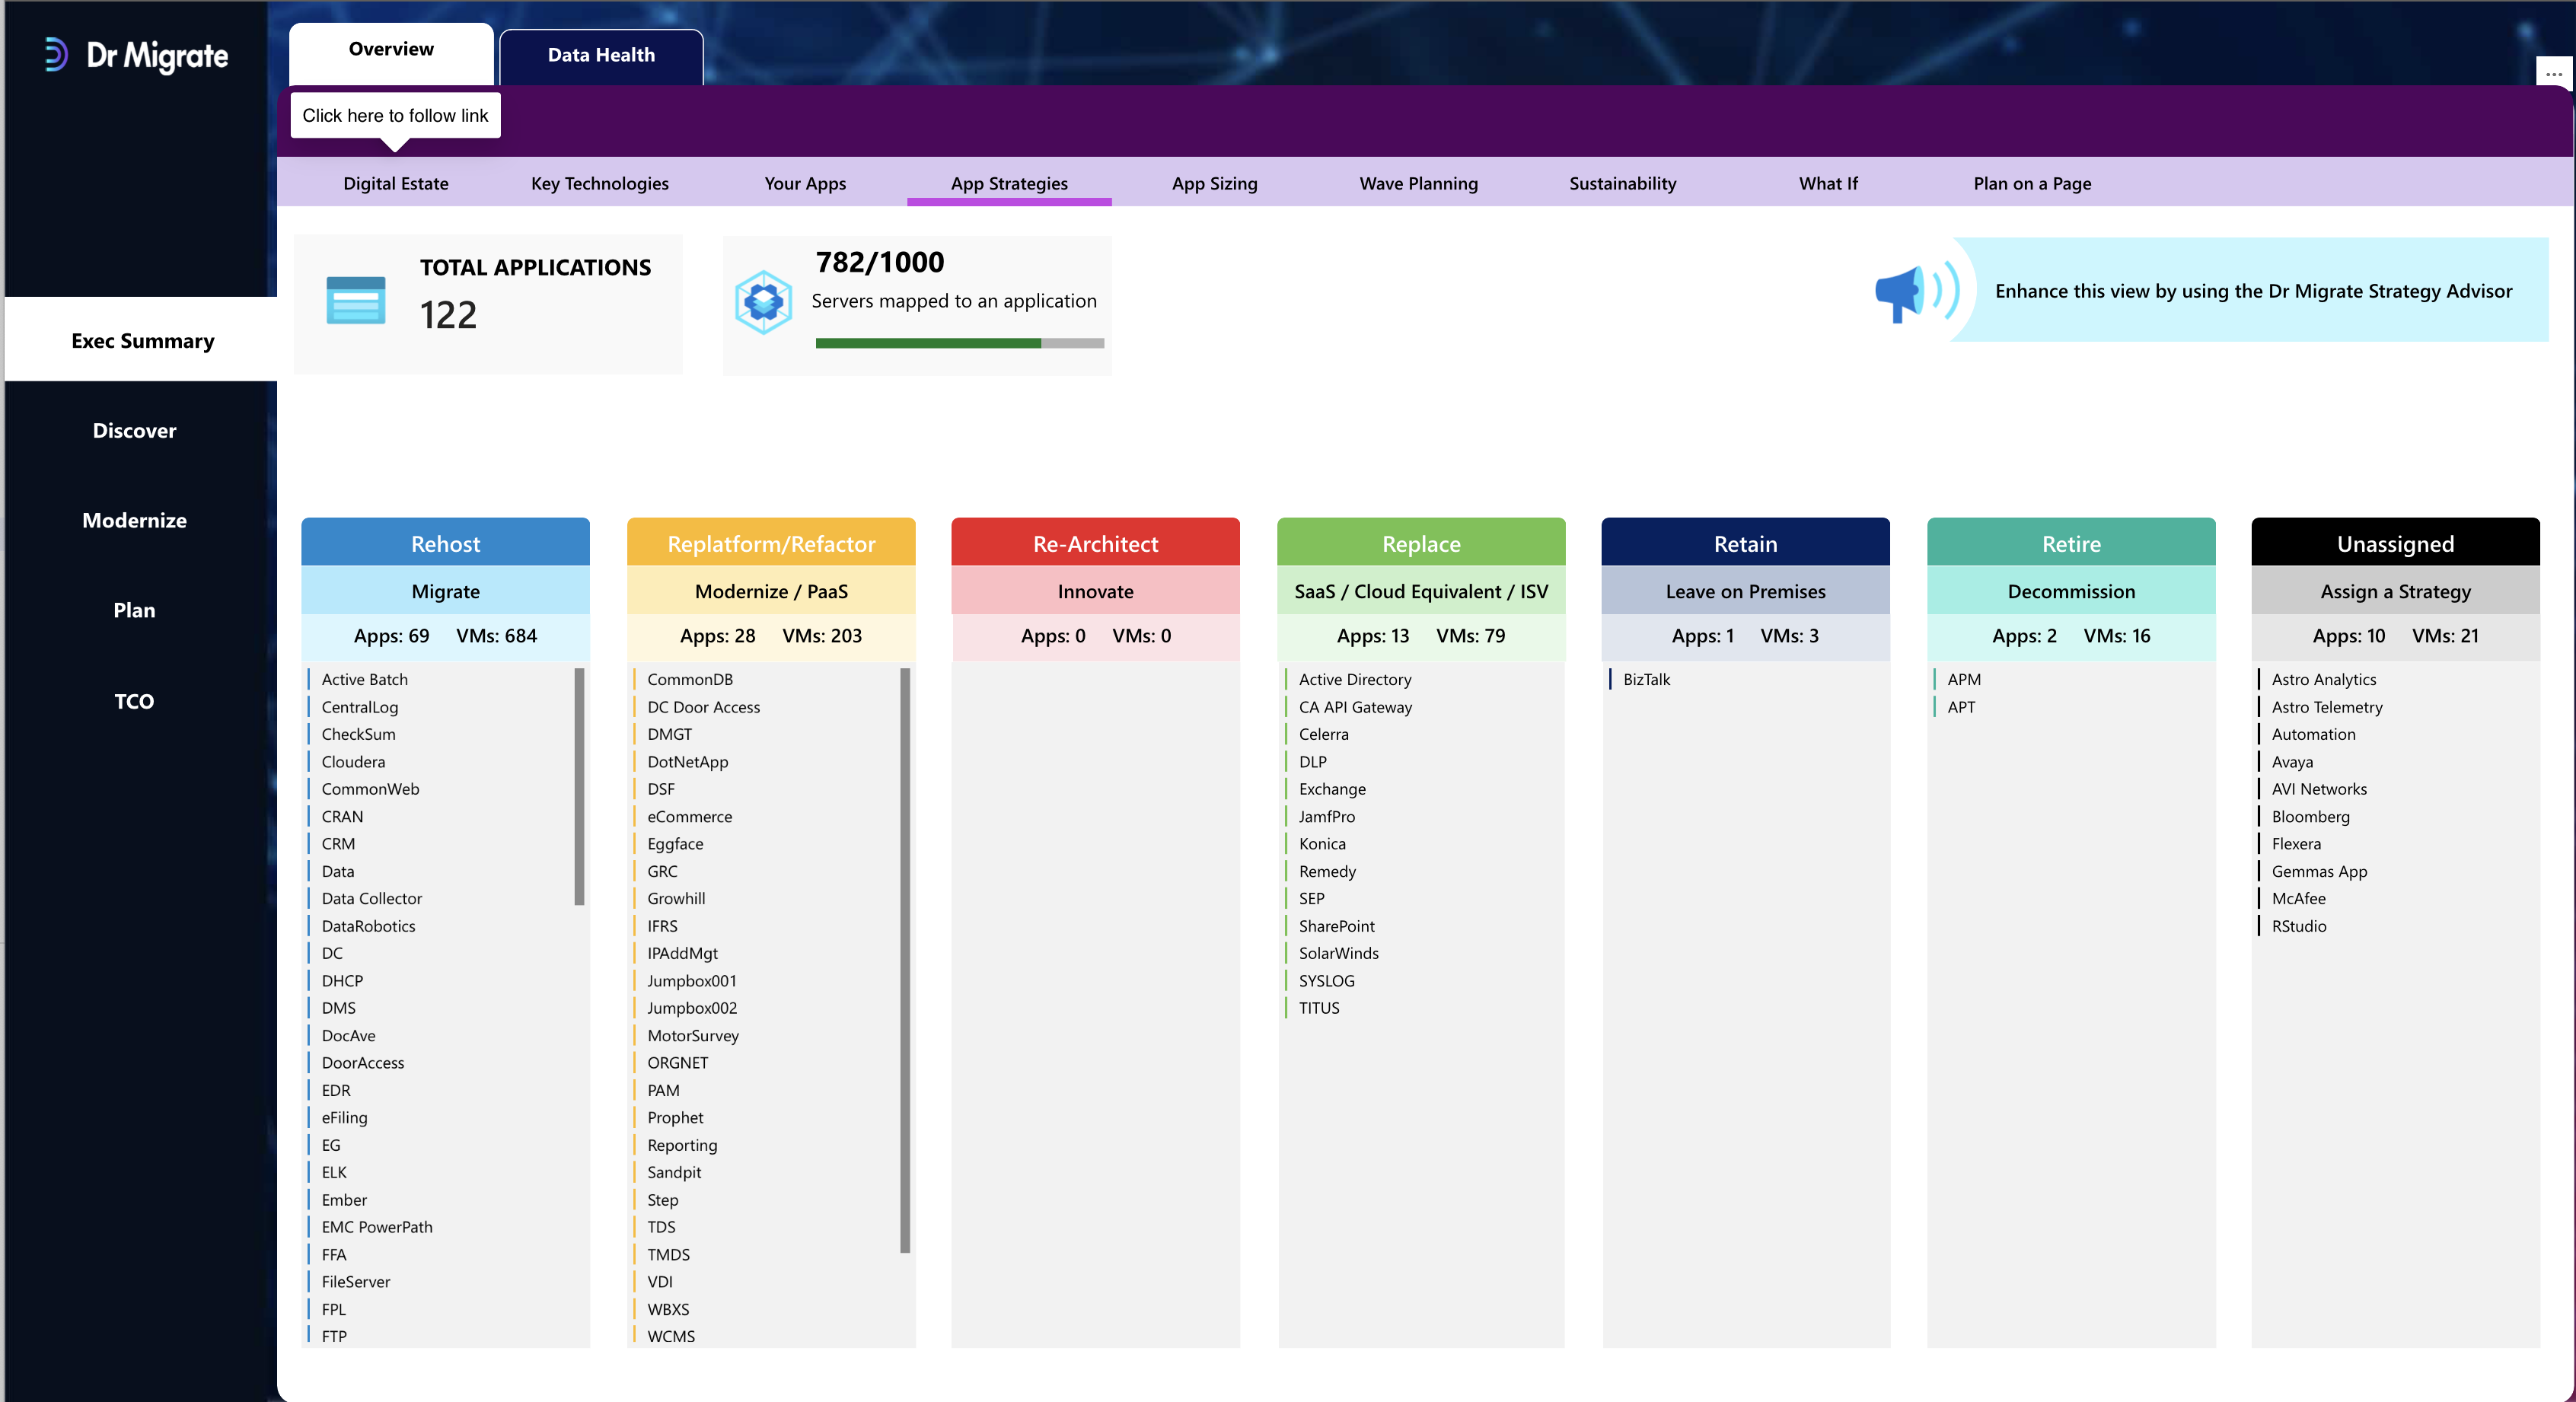
Apps 6Rouped by 6R strategy (6Rs):
- Rehost, Replatform, Refactor, Retire, Retain, Replace
- % of estate in each category
- Server impact per strategy
App Sizing
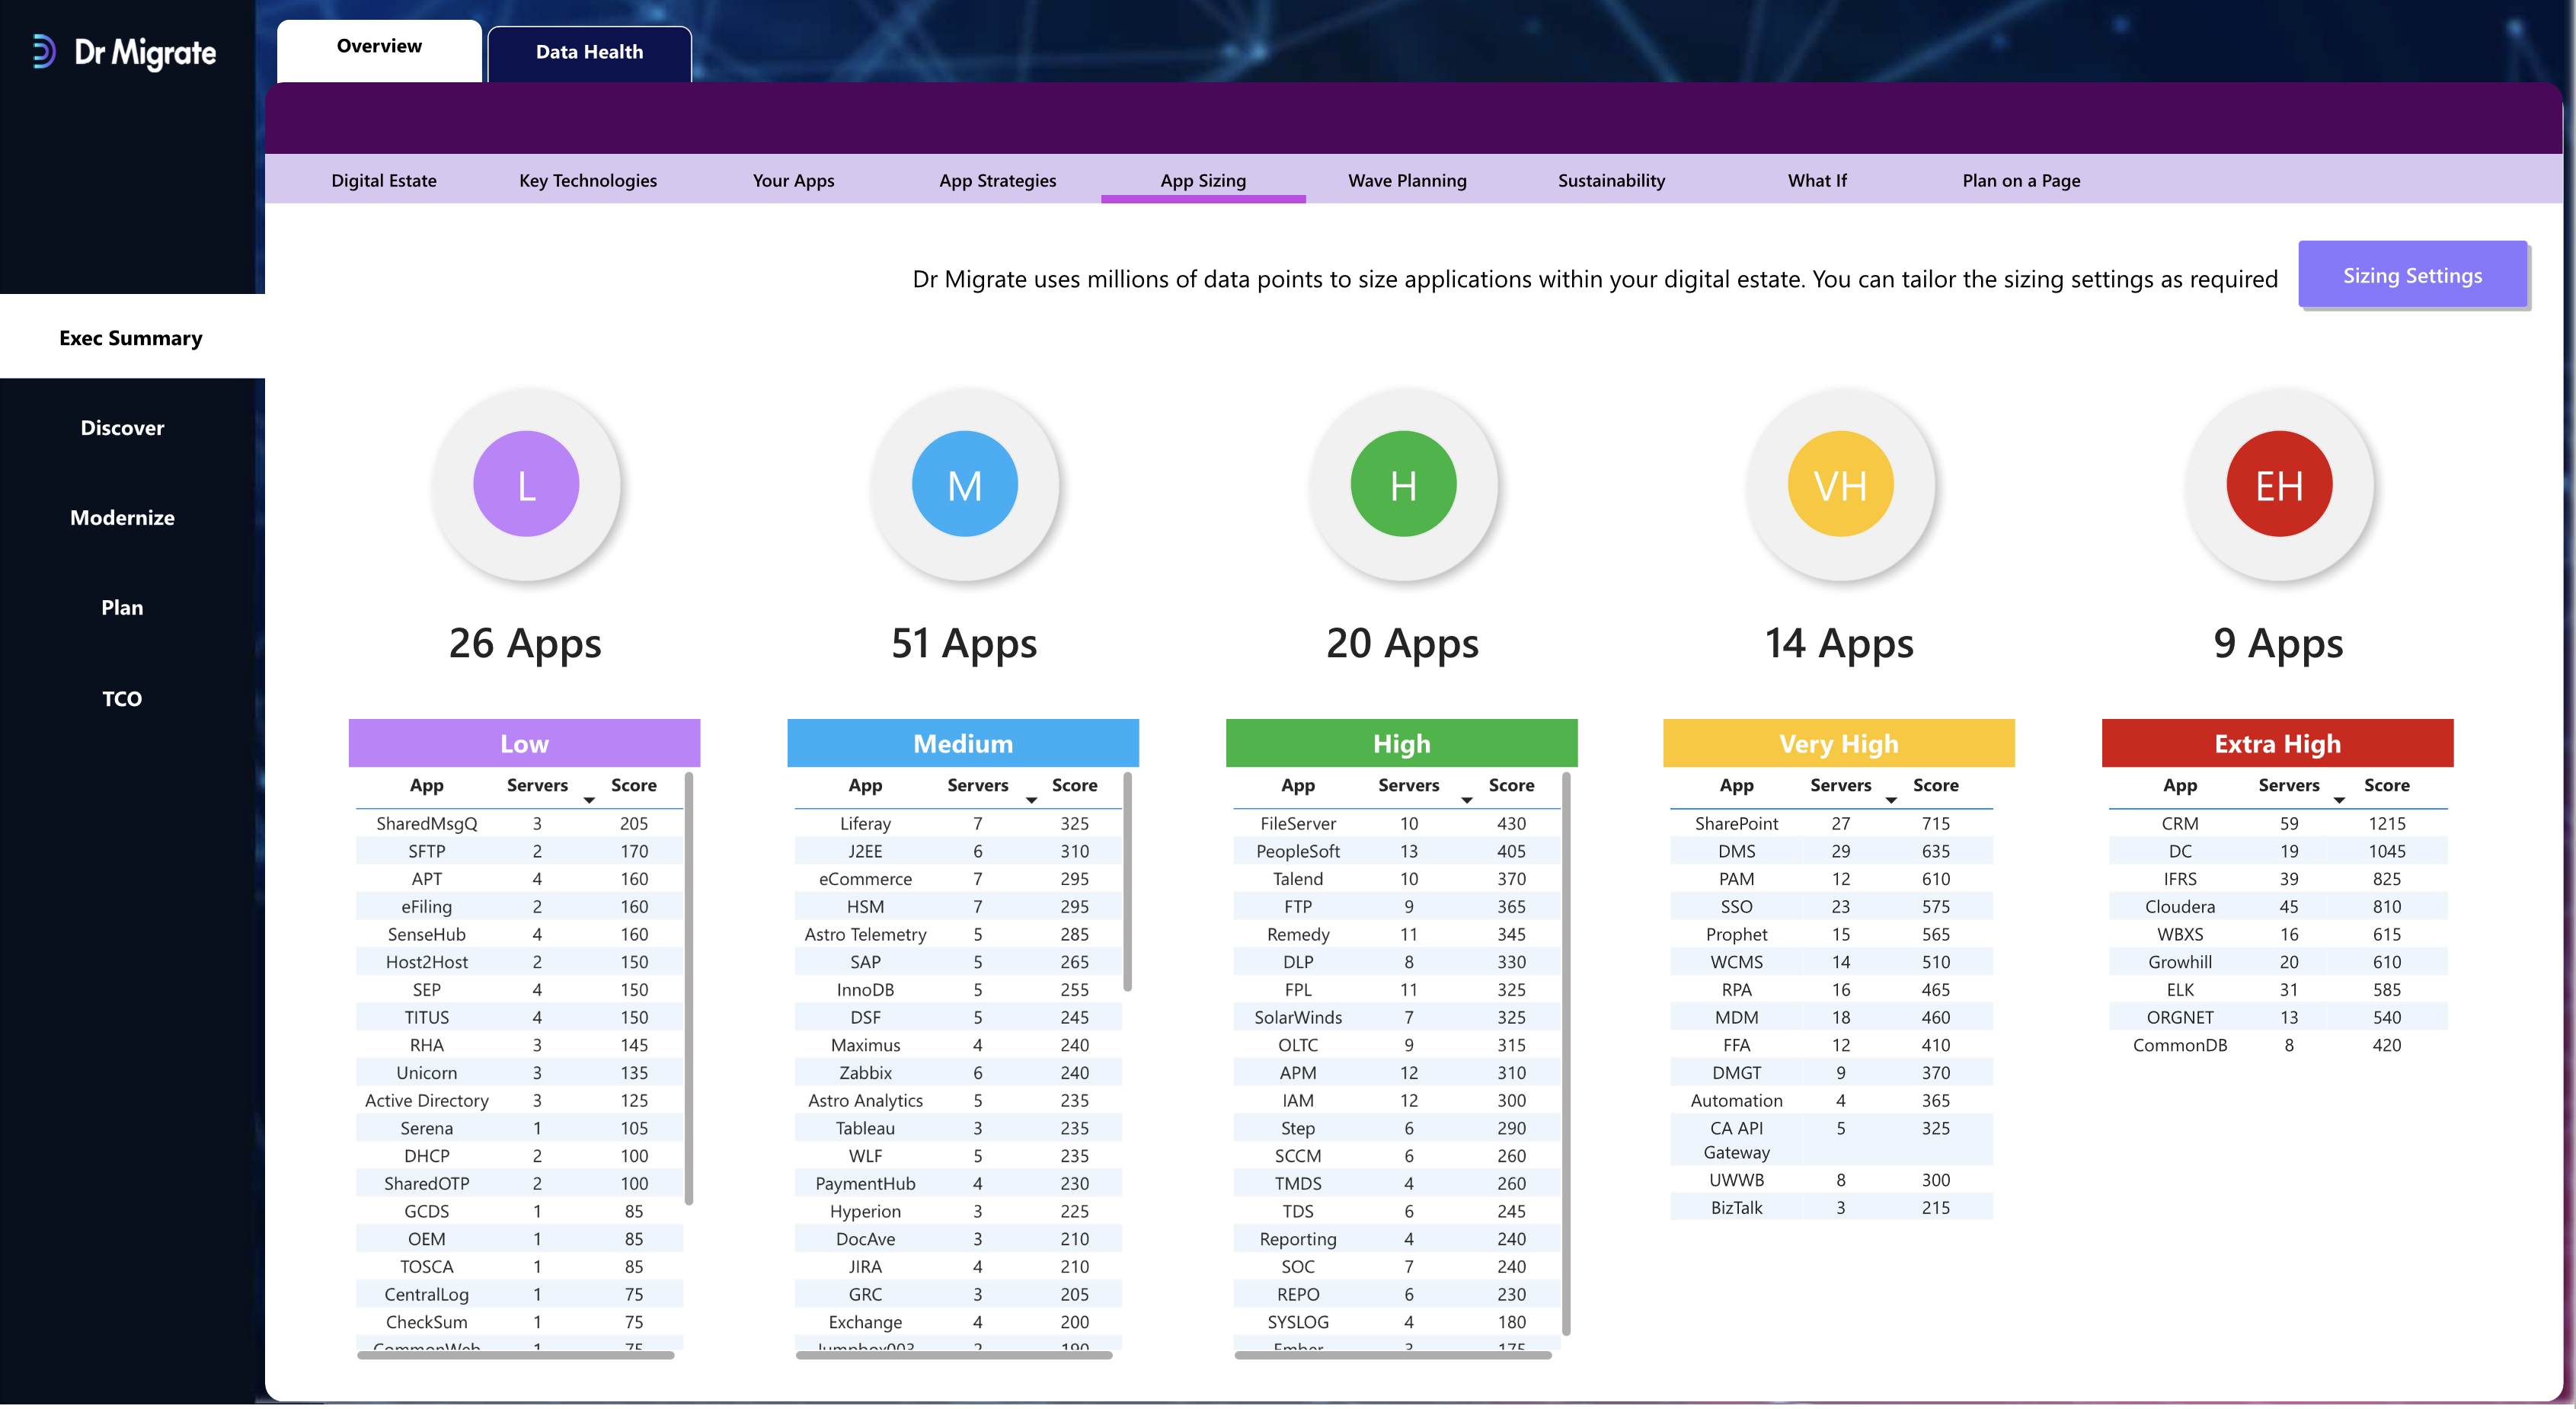
Breakdown of app complexity scores:
- Bands: Low, Medium, High, Very High, Extra High
- Used to prioritize waves
- Complexity is derived from signals like OS support, modernization blockers, agent presence
Wave Planning
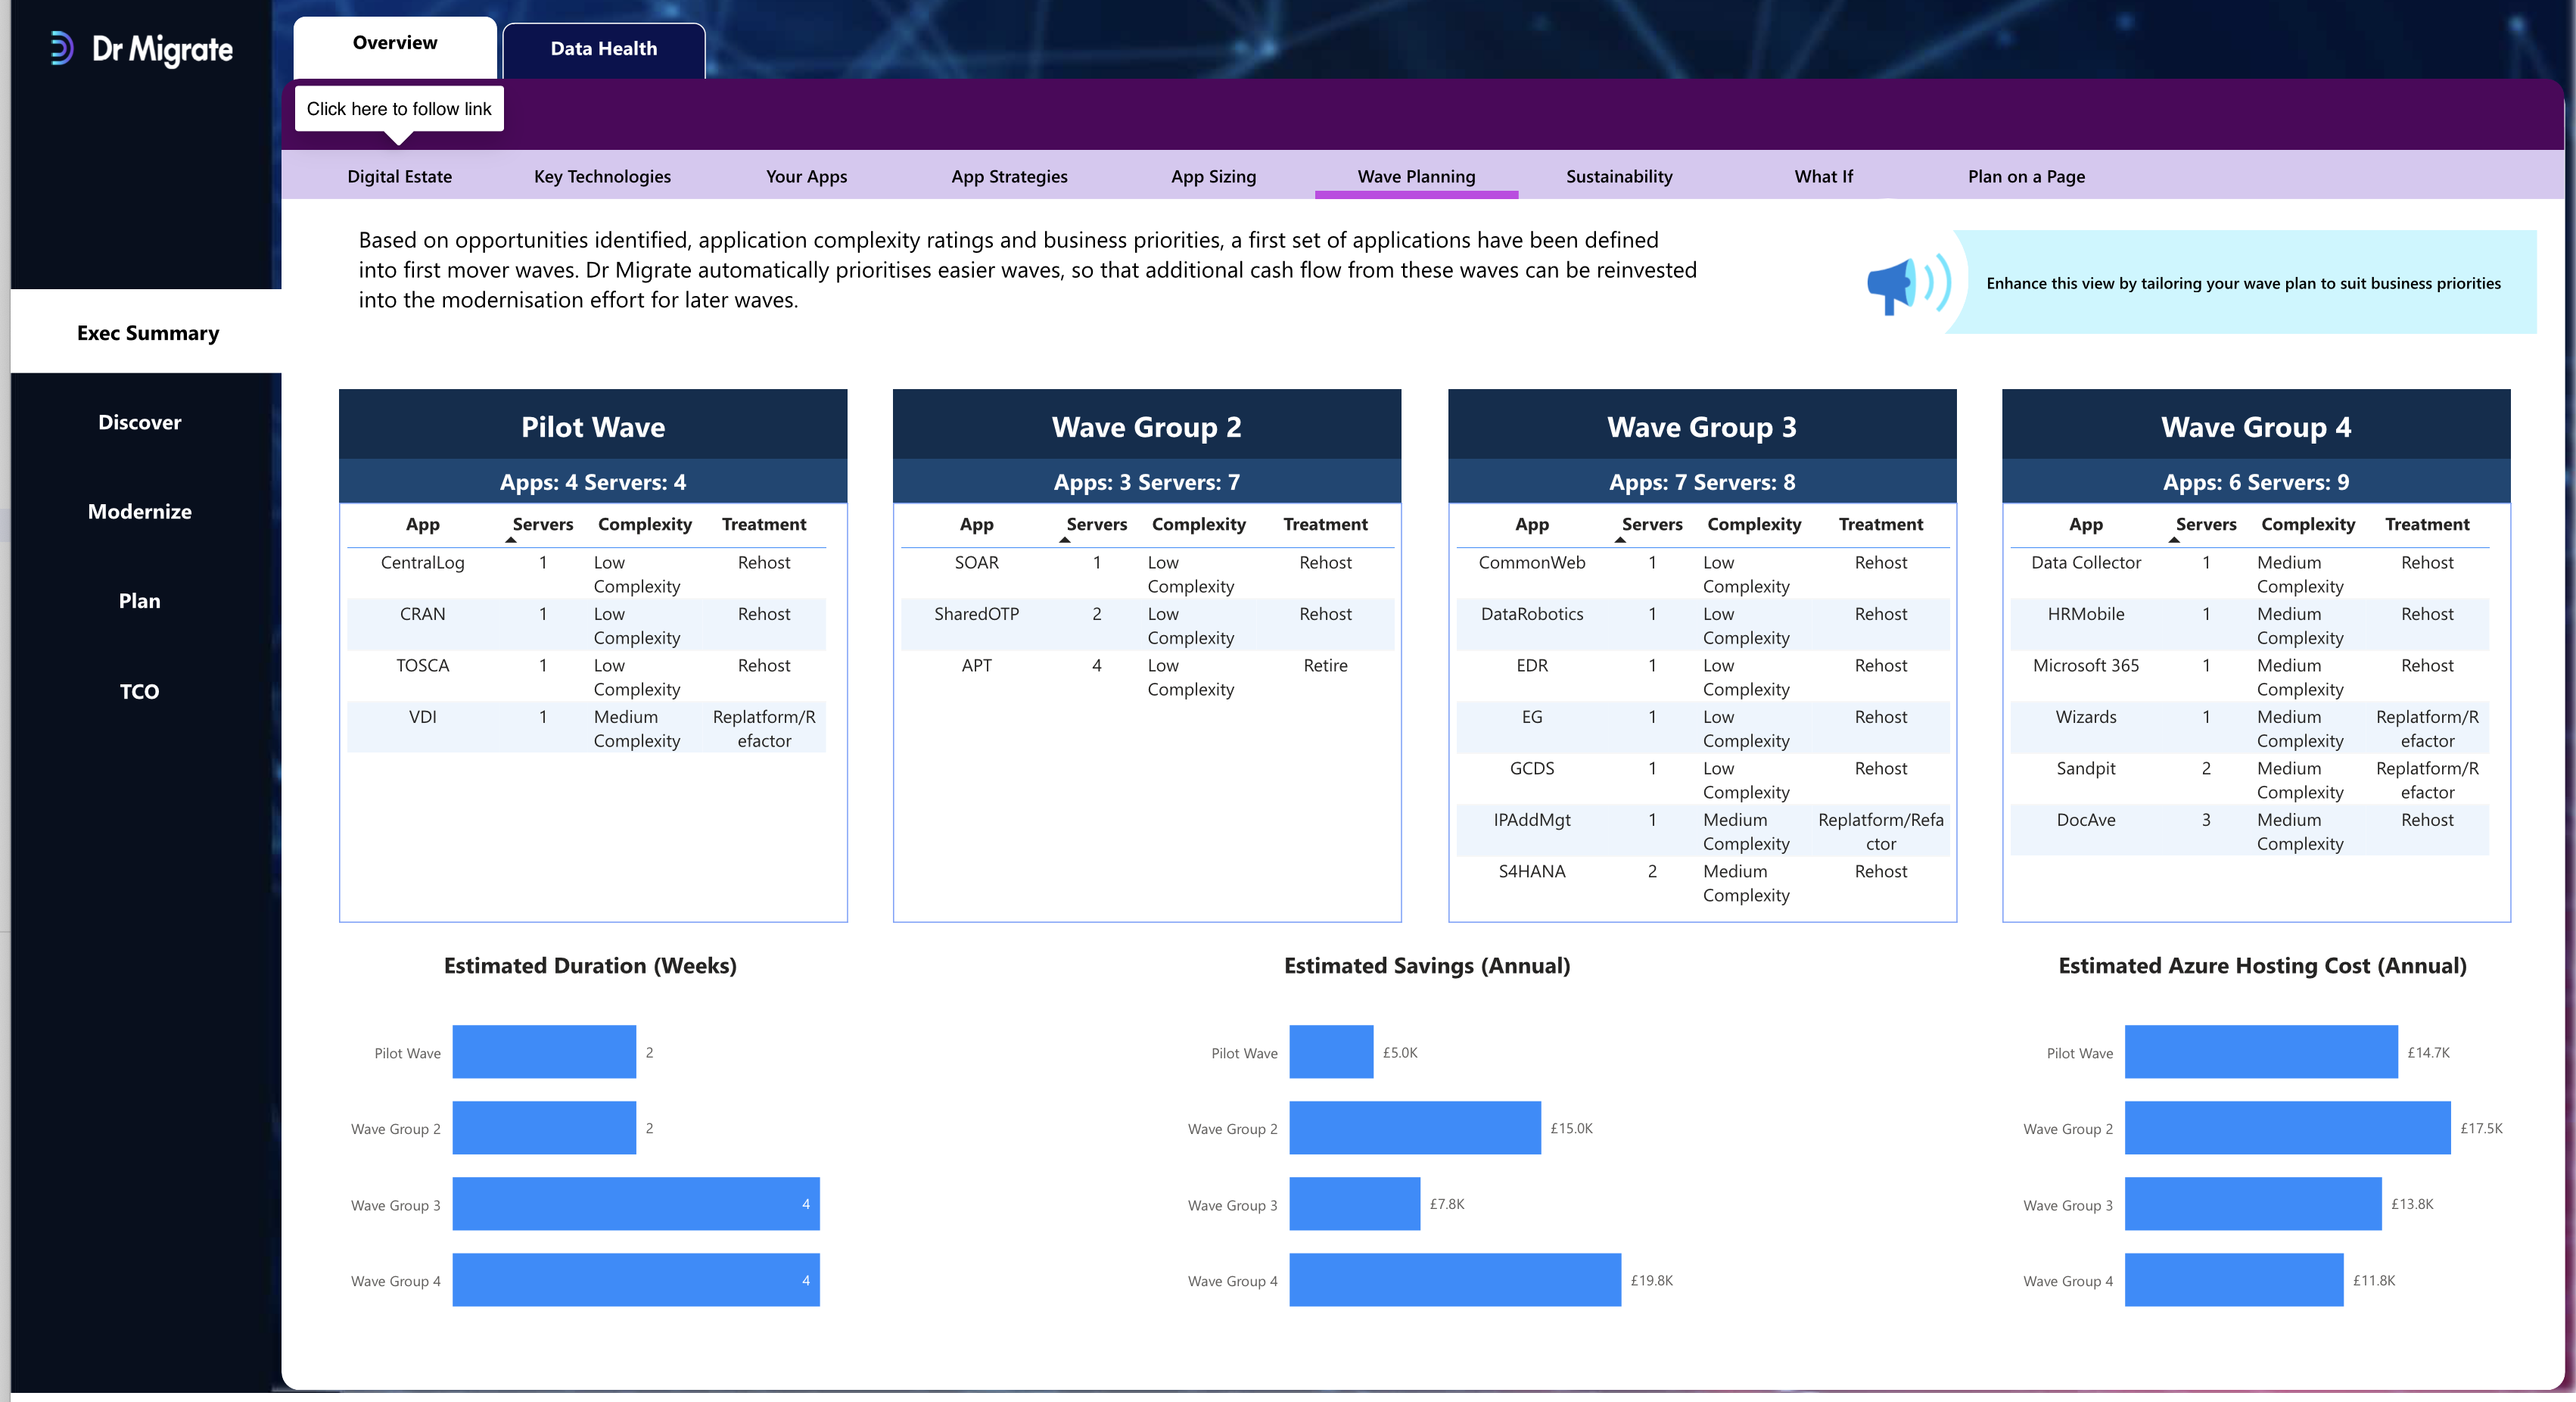
Visual summary of mi6Ration waves:
- Estimated durations
- Estimated Azure cost per wave
- Estimated savings per wave
- Apps in each wave, organized by size and strategy
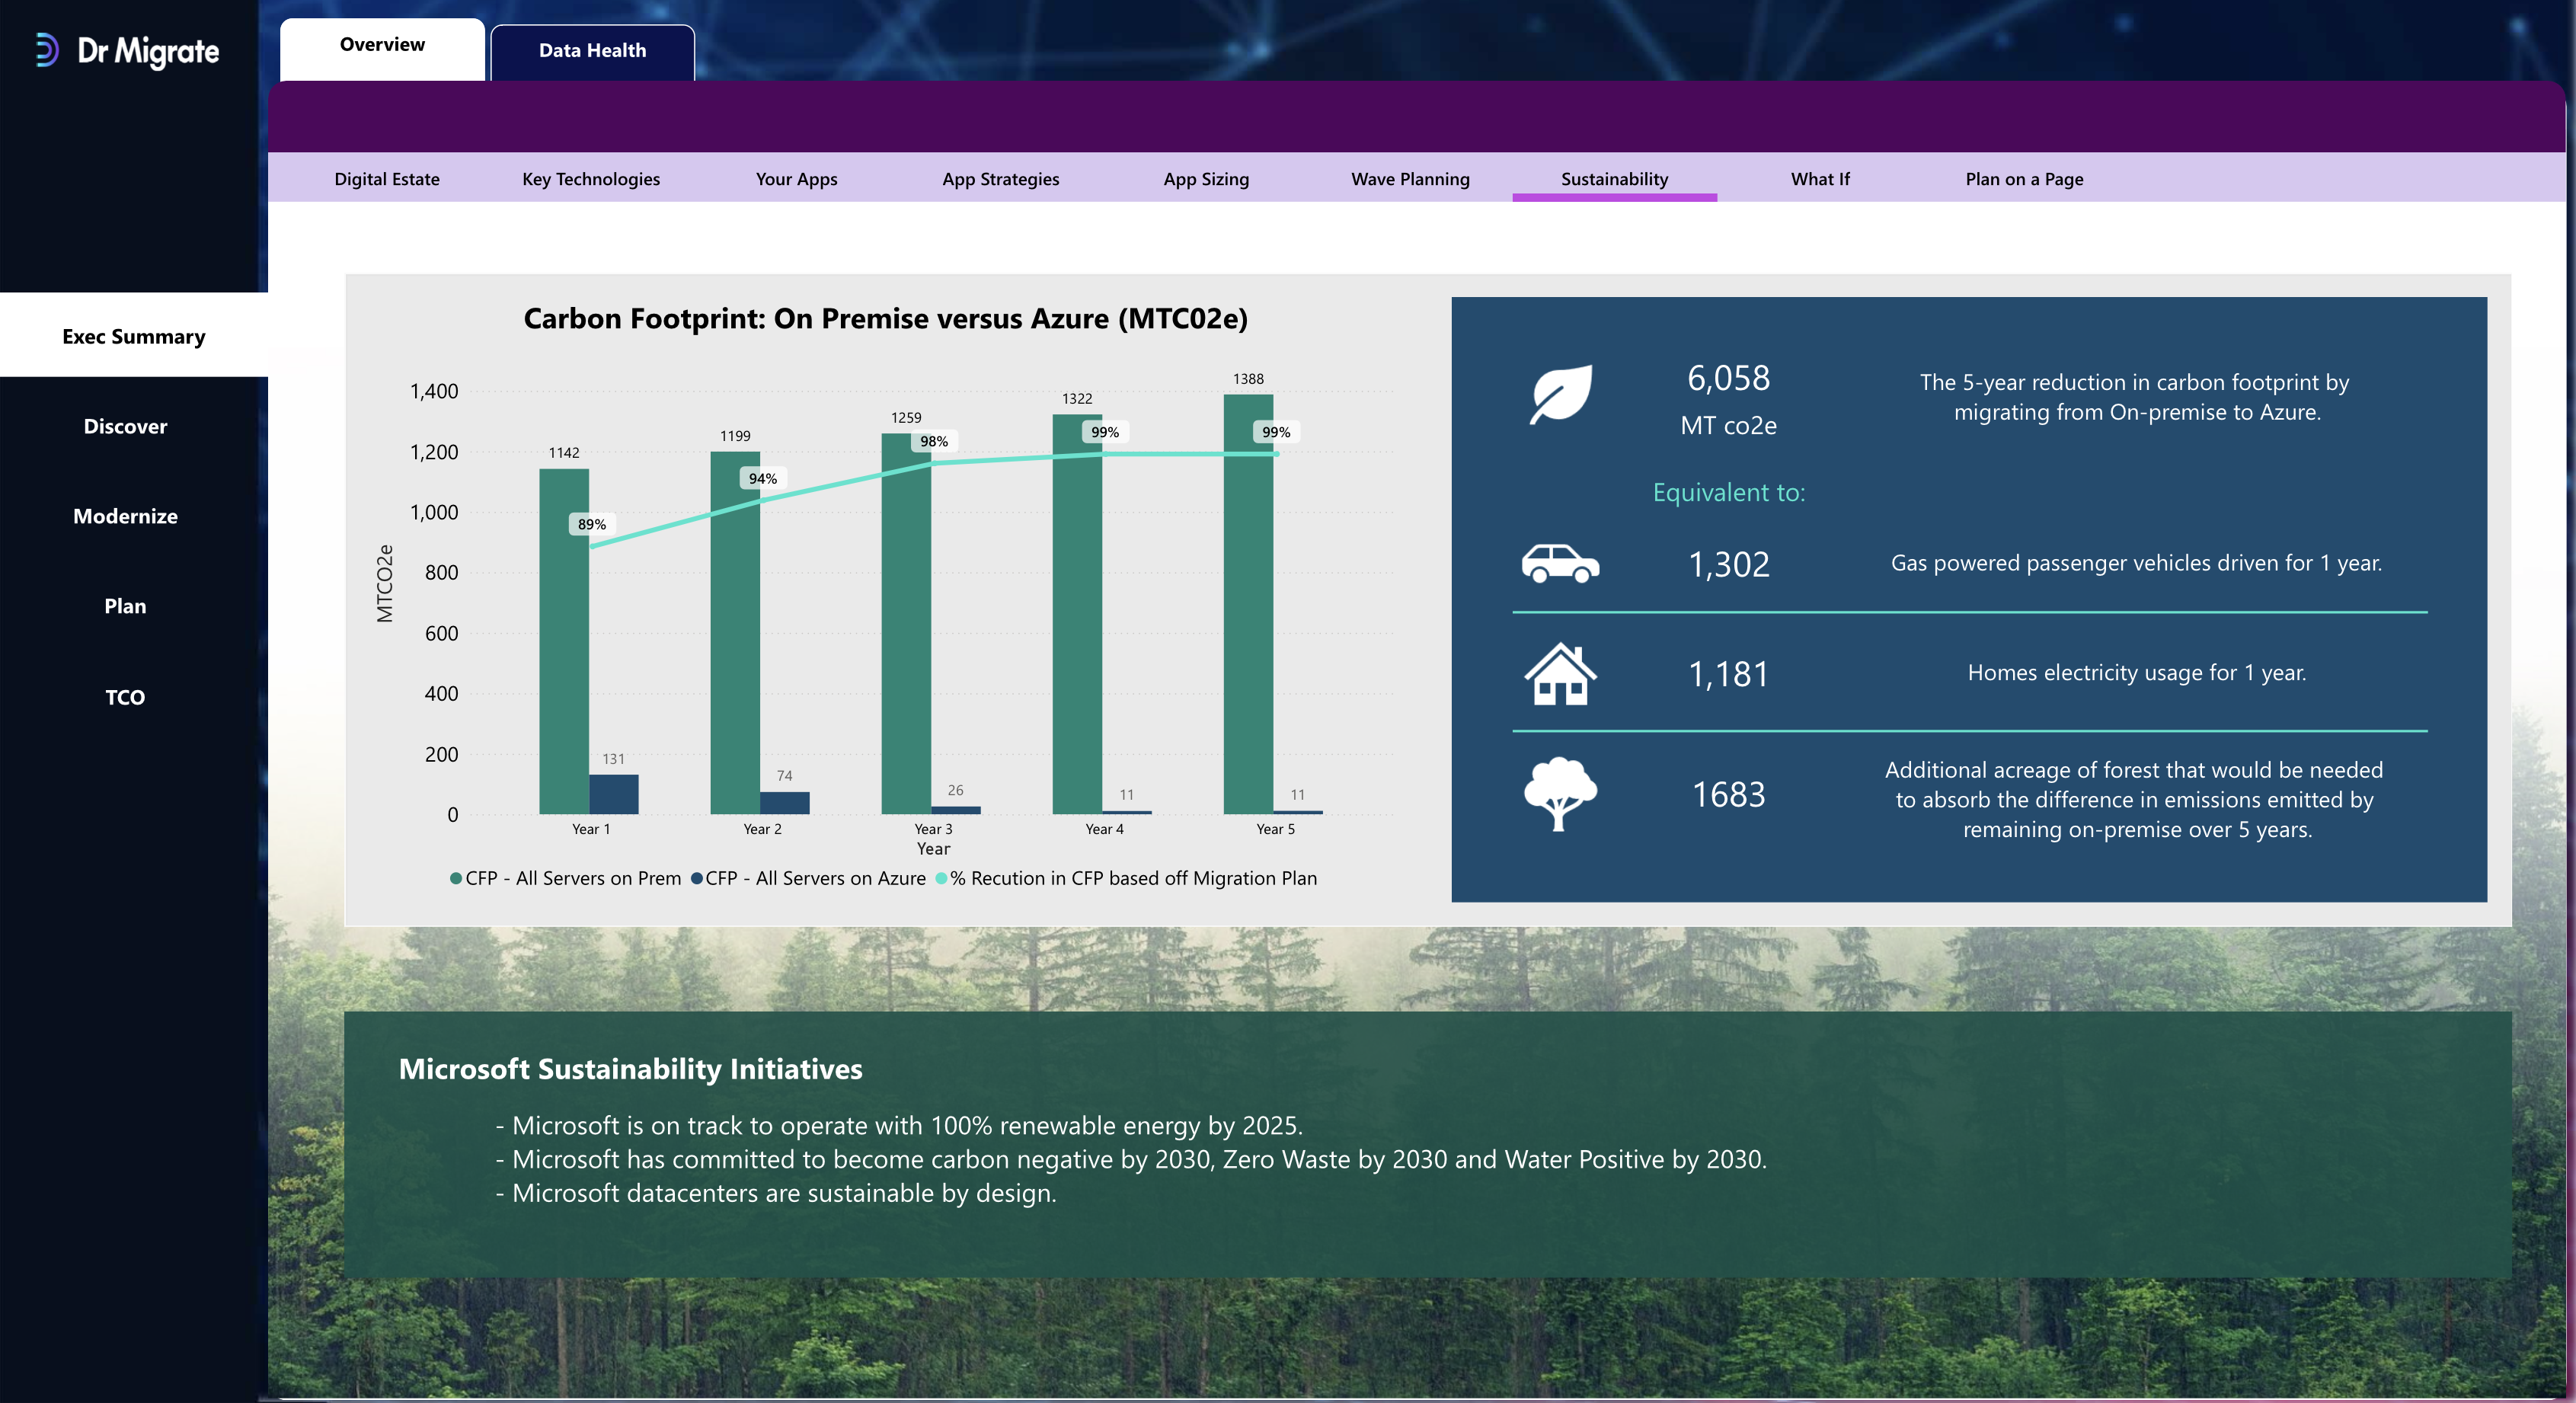
Sustainability
Estimates CO₂e reduction by moving from on-prem to Azure:
- Total and % savings
- Equivalents in “cars off road” or “acres of forest”
- Helps support sustainability reporting
What If
Scenario builder for Azure hosting assumptions:
- Swap region, purchasing model, storage tier
- Visualize cost impact before committing to strategy
TCO & Cost Modelling
Highlights cost comparisons between current and cloud hosting:
- On-Prem Equivalent cost
- Azure TCO per app, per wave
- Currency-adjusted outputs
- Breakdowns by treatment, vendor, tag
Final Reminders
- Refresh the report regularly after changes in Planning, Tags, or Scan uploads.
- Use Tags and App Filters to scope views cleanly.
- The Inventory tab is the best place to validate completeness.
- Additional help is available in the Help tab (coming soon).