Troubleshooting Report
After the scan completes, you can access detailed scan results through the Detailed Results modal in the Results page. This feature provides comprehensive troubleshooting capabilities to help identify and resolve scan issues.
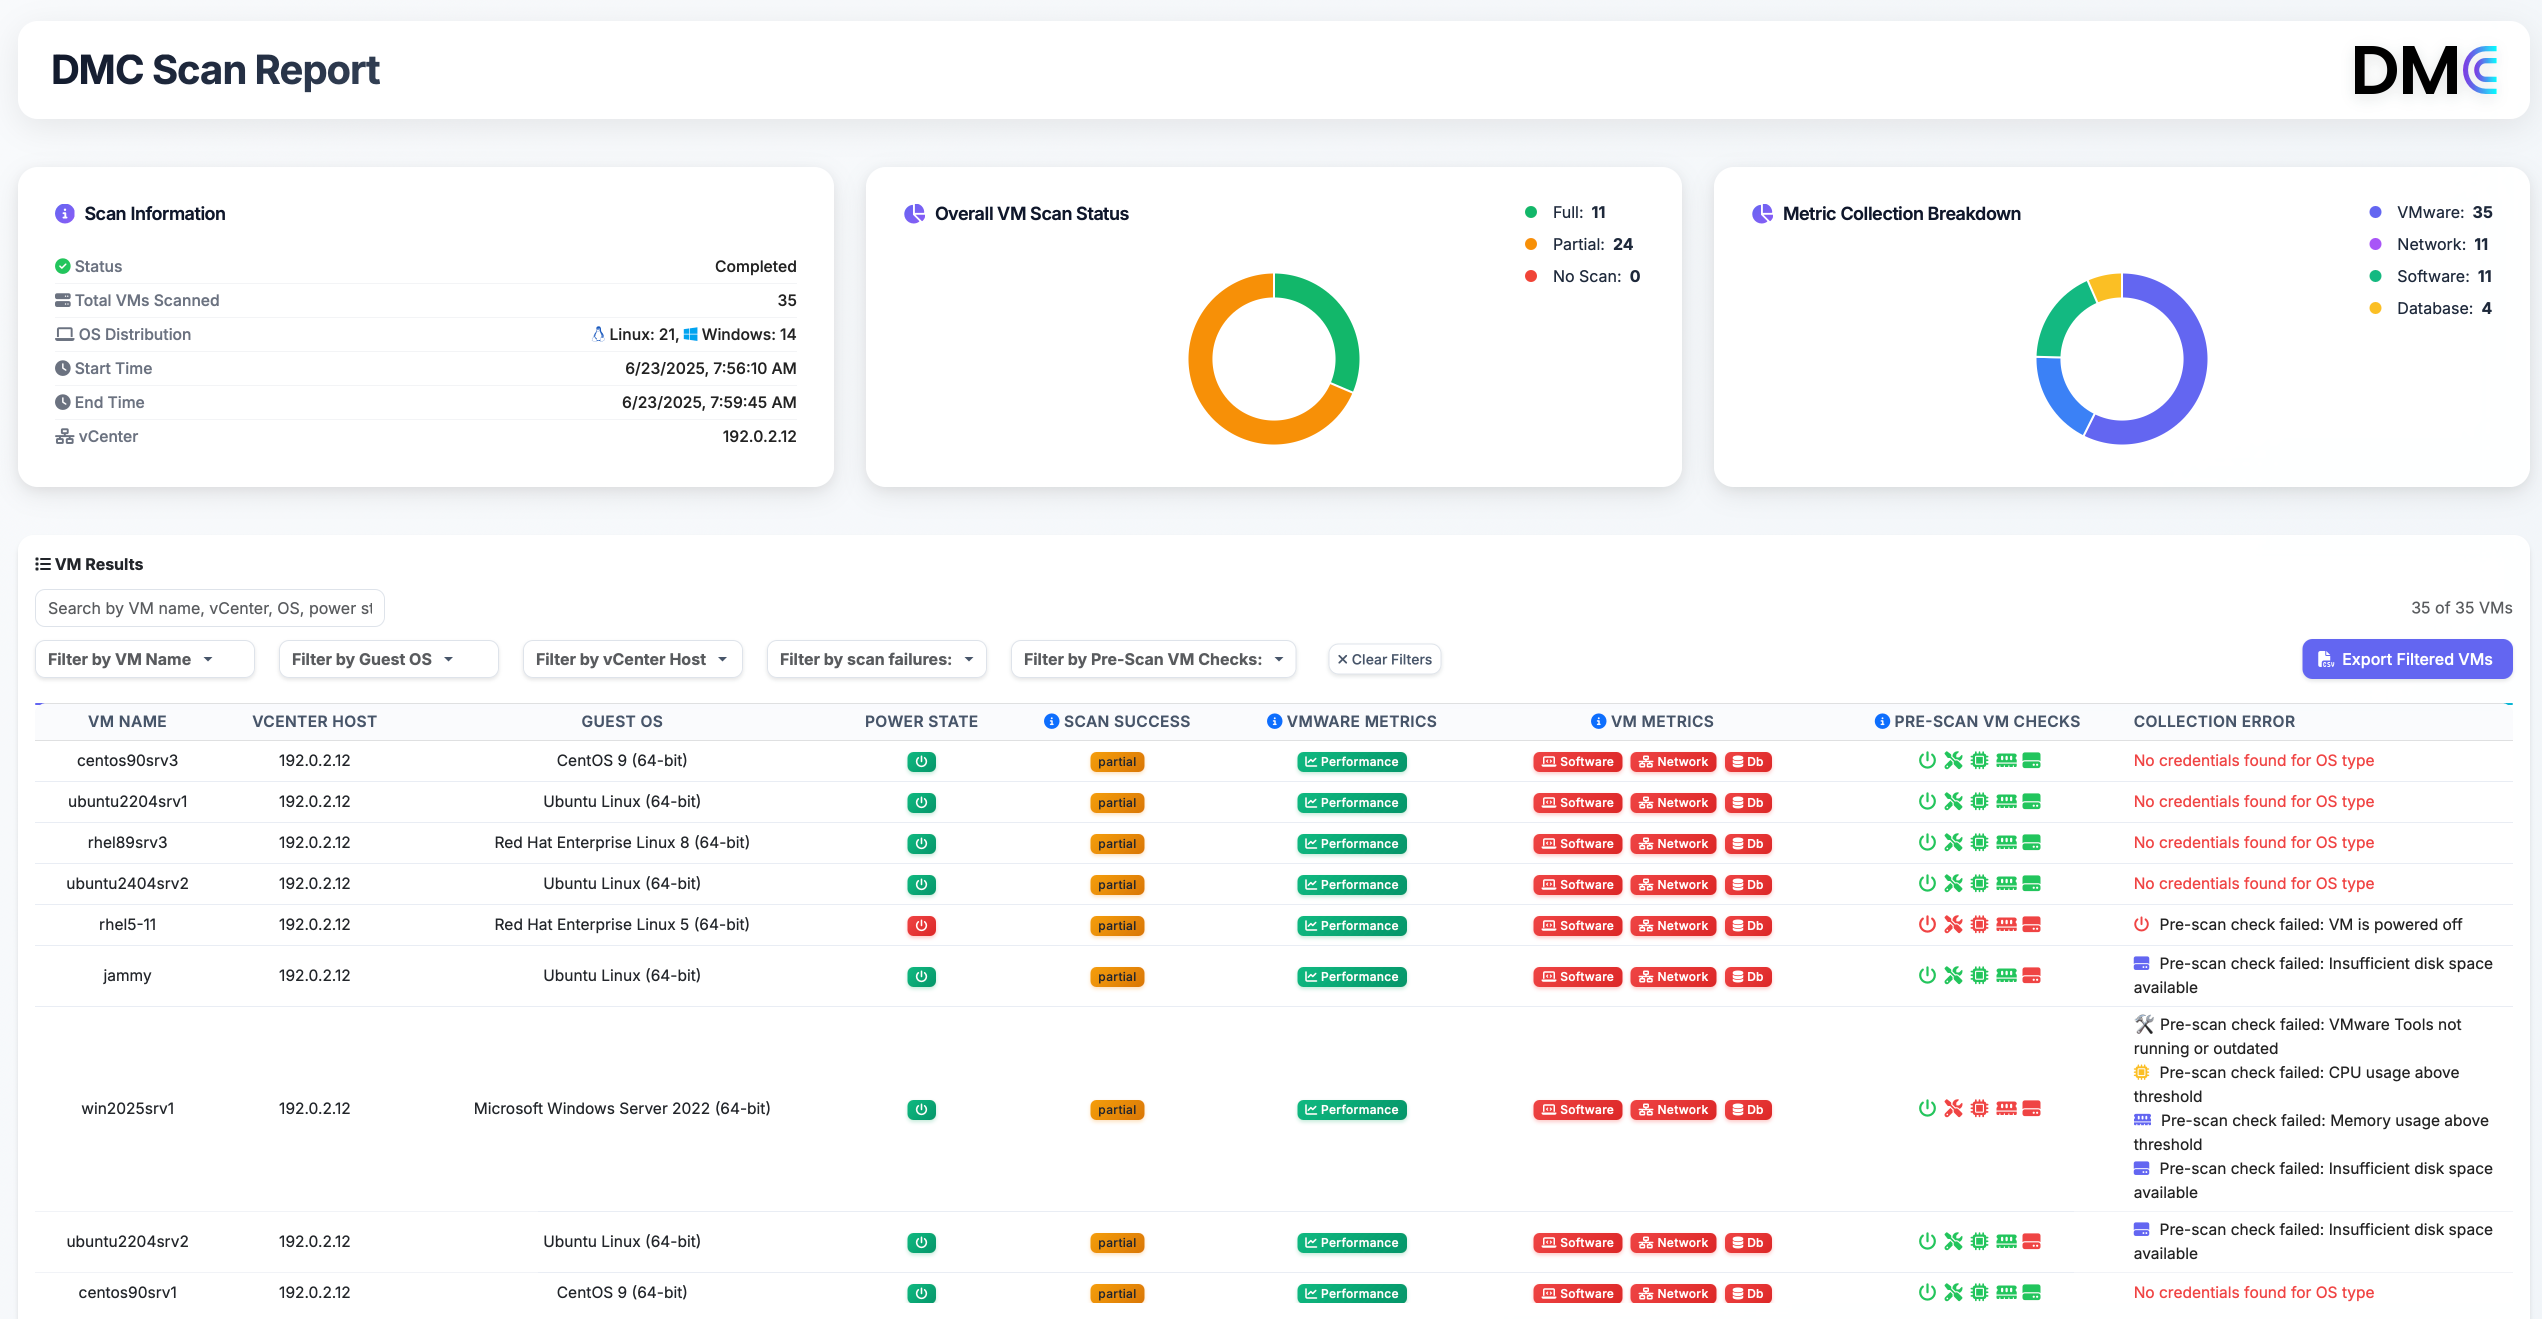
The detailed results view allows you to review which VMs or servers failed, investigate why, view log files, and collaborate with application or infrastructure teams using filtered exports.
You can download an Offline Troubleshooting Report as a standalone .html file from two locations:
- Results Page: Click the “Download Offline Report” button in the Results page
- Scan Target Selection Screen: After clicking “Finalise Scan”, you can click “Download Offline Report” from the scan target selection screen
This provides similar functionality in a portable format that can be shared or viewed offline.
Purpose
The Offline Report is intended to validate scan completeness and identify issues preventing successful data collection. It is not designed to show transformation or migration readiness results.
Key Features
-
Filter by ESXi Host and Search
Filter results by ESXi Host (vCenter) using the dropdown filter, and search by VM Name or Error Description using the search box. -
Sortable Table Columns
Click column headers to sort by VM Name, OS Type, Error Description, or Resolution. Failed items are automatically prioritized at the top. -
Pagination
Results are paginated with 10 items per page. Navigate between pages using Previous/Next buttons or view page information showing current range and total items. -
Detailed Results Table
View comprehensive information including:- VM Name
- OS Type
- Error Description (if any)
- Log Path (clickable to open log files)
- Resolution suggestions
-
Export Filtered Results to CSV
Export any filtered subset of results as a.csvfile — ideal for sharing with application owners or remediation teams. -
Chart Visualizations
View three donut charts showing success/failure rates for:- VMware Scan Results
- Software Scan Results
- Network Scan Results
Table Columns
| Column | Description |
|---|---|
| VM Name | Name of the virtual machine or server that was scanned |
| OS Type | Operating system type (Windows, Linux, etc.) |
| Error Description | Specific error message if the scan failed or was partial. Shows “Scan successful” for completed scans |
| Log | Clickable link to open the VM’s log file for detailed troubleshooting |
| Resolution | Suggested resolution steps based on the error type (e.g., “Verify credentials are configured correctly”, “Check network connectivity”) |
Accessing Detailed Results
The Detailed Results modal can be accessed from the Results page. The Offline Troubleshooting Report can be downloaded from either the Results page or the Scan Target Selection screen:
-
Open the Detailed Results Modal
Click the “View” button next to any discovery target in the “Scan Results Per Discovery Target” table, or use the detailed results button if available. The modal will open showing all scan results for that target. -
Filter and Search Results
Use the interactive controls to filter and search:- ESXi Host Filter: Select a specific ESXi Host from the dropdown to view results for that host only, or select “All ESXi Hosts” to see all results
- Search Box: Type VM names or error descriptions to quickly find specific entries
- Filters and search work together — you can filter by host and then search within those results
-
Sort and Navigate Results
- Click any column header (VM Name, OS Type, Error Description, Resolution) to sort by that column
- Click again to reverse the sort order
- Use pagination controls to navigate through large result sets
- Failed items are automatically shown first regardless of sort order
-
View Log Files
- Click the “Open log” link in the Log column to open the VM’s log file in your system’s default text editor
- Log files contain detailed scan execution information for troubleshooting
-
Export Filtered Results to CSV
After applying your desired filters and searches:- Click the “Export Results” button
- A
.csvfile will be downloaded containing all filtered results (not just the current page) - The CSV includes: VM Name, OS Type, Error Description, Log Path, and Resolution
Offline HTML Report: If you prefer a standalone report file, click “Download Offline Report” from either:
- The Results page (after scan completion)
- The Scan Target Selection screen (after clicking “Finalise Scan”)
This generates a portable .html file that can be opened in any browser without requiring the DMC application.
The CSV export is performed entirely in the browser. No data is uploaded externally. CSV output includes all filtered results, not just the currently visible page.
Special Notes
Chart Data: The three donut charts at the top of the modal show aggregate success/failure rates across all scan types. These update based on your current filters.
Resolution Suggestions: The Resolution column provides actionable guidance based on common error types:
- Credential errors: “Verify credentials are configured correctly for this OS type”
- Network errors: “Check network connectivity and SSH service status. Verify firewall rules.”
- Health check failures: “Ensure VM is powered on and accessible”
Log File Access: Log files contain detailed execution information including timestamps, error messages, and scan phase details. These are invaluable for troubleshooting specific issues.
Export Scope: The CSV export includes all filtered results, not just the currently visible page. This ensures you can export complete filtered datasets for analysis or sharing.
Use Cases
- Identify Failed Scans: Use the ESXi Host filter and search to quickly find VMs with errors
- Troubleshoot Specific Issues: Click log file links to review detailed execution logs for failed scans
- Export Problem Lists: Filter for errors, then export to CSV to share remediation lists with teams
- Review Scan Success Rates: Use the charts to understand overall scan health across VMware, Software, and Network scan types
- Organize by Environment: Filter by ESXi Host to review results for specific vCenters or environments
- Track Resolution Progress: Use sortable columns and pagination to review large result sets efficiently