

Network Overview
The Network tab reveals connectivity, dependencies and traffic patterns across the estate, giving you the context you need before grouping applications into waves. It gives an estate-level view of which applications are most connected, which are exposed to the internet, and where risky ports are in use, then lets you drill into any single application's detailed dependency flows. The Network Estate lens adds a map of the whole estate, showing every application, the Azure and AWS services it depends on, and the connections between them.
Headline tiles
Four tiles summarise network activity and risk at a glance: Total Connections (the overall volume of analysed network flows across the estate), High Dependency Apps (applications heavily entangled with the rest of the estate), Internet-Facing Applications (those with external exposure) and Potential Risk Ports (open ports that warrant review). Together they tell you where connectivity will most influence sequencing and security decisions.
Network Lens
The Network Lens buttons along the top of the tab re-frame the estate view around a particular concern:
- Network Estate: a map of every application in the estate, the cloud services they use and the dependencies between them (see Network Estate Overview).
- Application Dependencies: the headline tiles and the Applications by Network Gravity table.
- Cross-Env Traffic: applications talking across environment boundaries.
- External Connections: applications with external connectivity.
- Port Risk: applications using ports flagged as potentially risky.
- Insights: a summary view showing Total Connections, Risky Ports, External Connections and Cross-Environment Traffic panels, plus a banner recommending connecting Dr Migrate to a real-time dependency data source for richer flow data.
Network Estate Overview
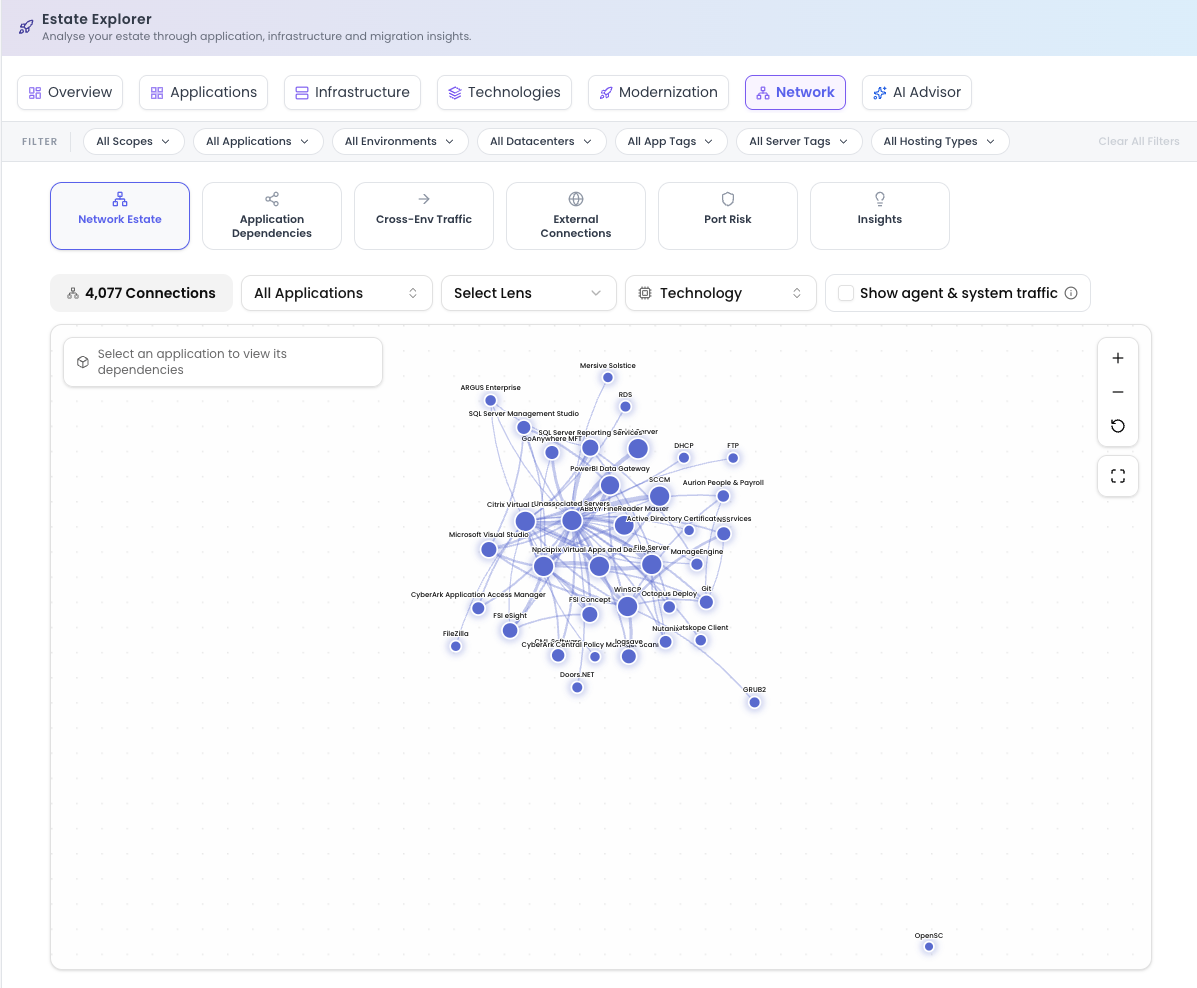
The Network Estate lens is the first view on the Network tab. You land on a map of every application in the estate, with the connections between them drawn as links, so you can see which applications talk to each other and how the estate fits together.
Use it to understand the shape of the estate before you plan. It shows which applications sit at the centre of many connections, which cluster together and which stand alone. Where the Applications by Network Gravity table counts dependencies, the estate overview shows them as relationships between your application workloads.
Select an application on the map to highlight its dependencies. Filters above the map let you narrow the view to the traffic you want to see. To follow a single application's connections in detail, open it in the Application Drawer's Networking tab.
Agent and system traffic
The Show agent & system traffic checkbox above the map is unticked by default, so the map hides traffic from monitoring, security, backup and management agents, and routine infrastructure chatter such as DNS, DHCP, NTP, Active Directory and RDP. Tick the box to show that traffic.
Cloud service nodes
When an Azure or AWS scan has been loaded, the cloud services your applications connect to appear on the map as their own nodes, one per service type, for example Azure SQL, Azure Storage or AWS NAT Gateway. They are drawn in the cloud's colour and listed in the legend as Cloud service. Traffic to a cloud address that cannot be matched to a specific service is grouped under Azure (unidentified) or AWS (unidentified).
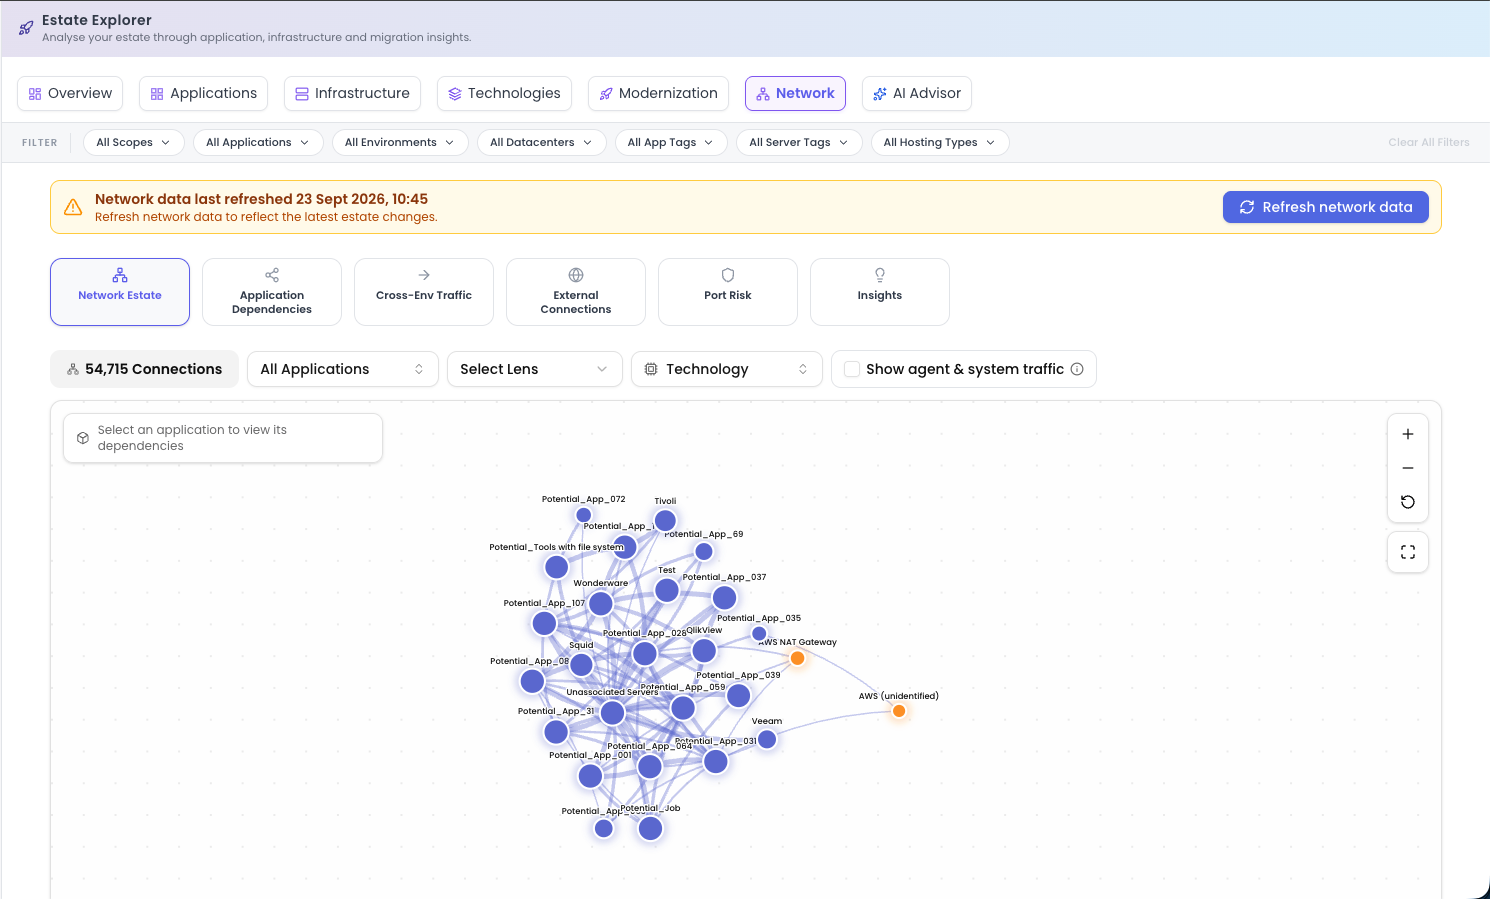
Click a service node to see how many resources it covers, how many applications depend on it and the date of the scan it was identified from. View in Azure Services or View in AWS Services opens the matching view under Estate Explorer → Infrastructure.
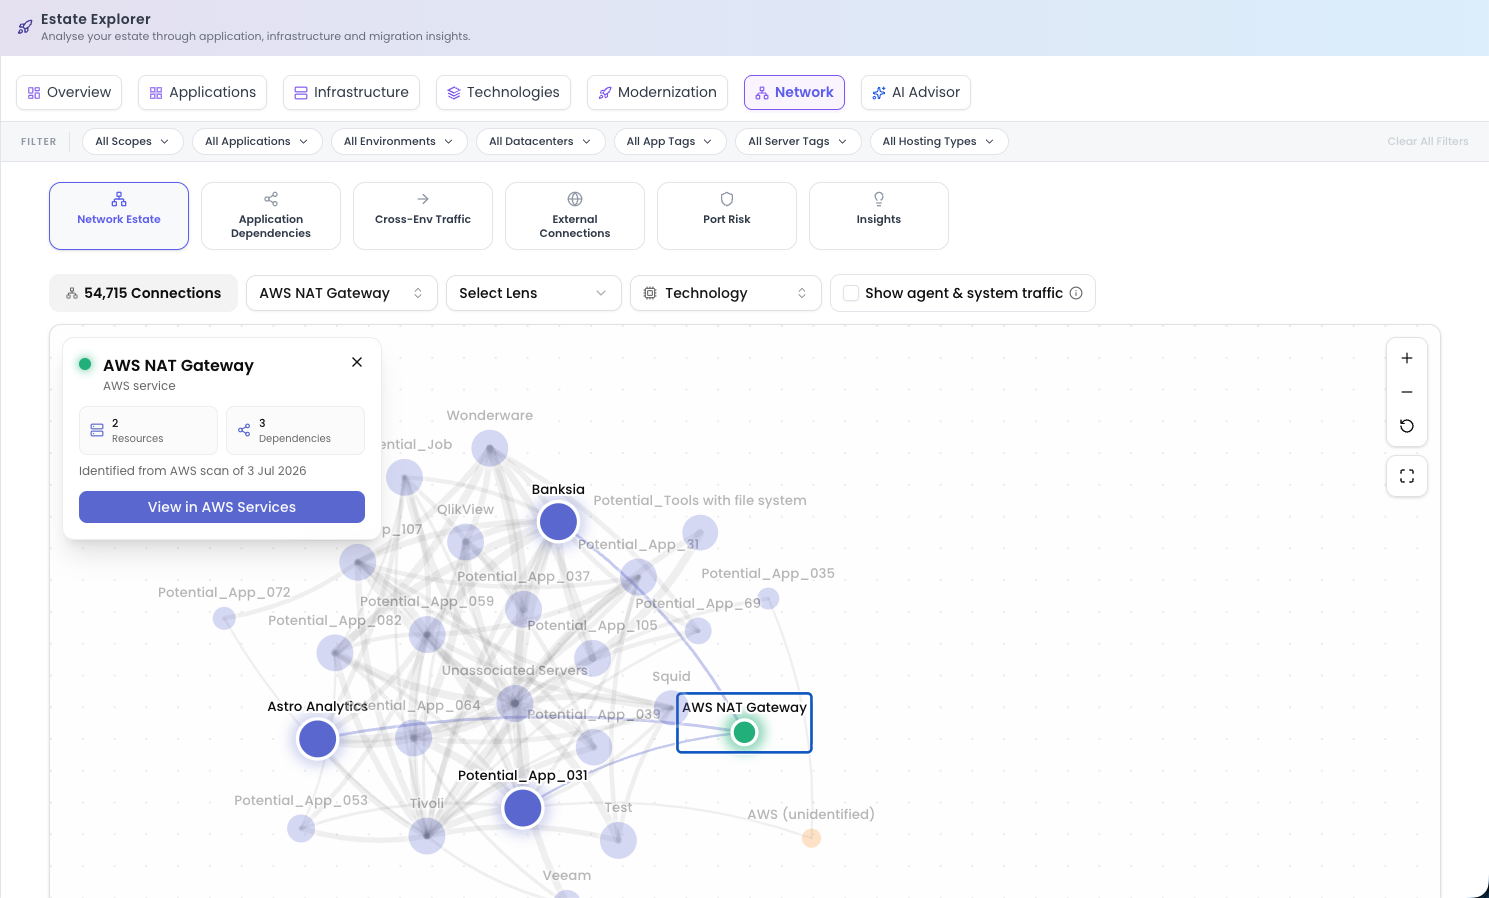
Service nodes are not counted as applications, and the Show agent & system traffic checkbox applies to them as well. A newly loaded cloud scan appears on the map after the next network data load.
Services reached only by DNS name, such as AWS RDS or load balancers, are not identified yet and still appear as external connections.
Applications by Network Gravity
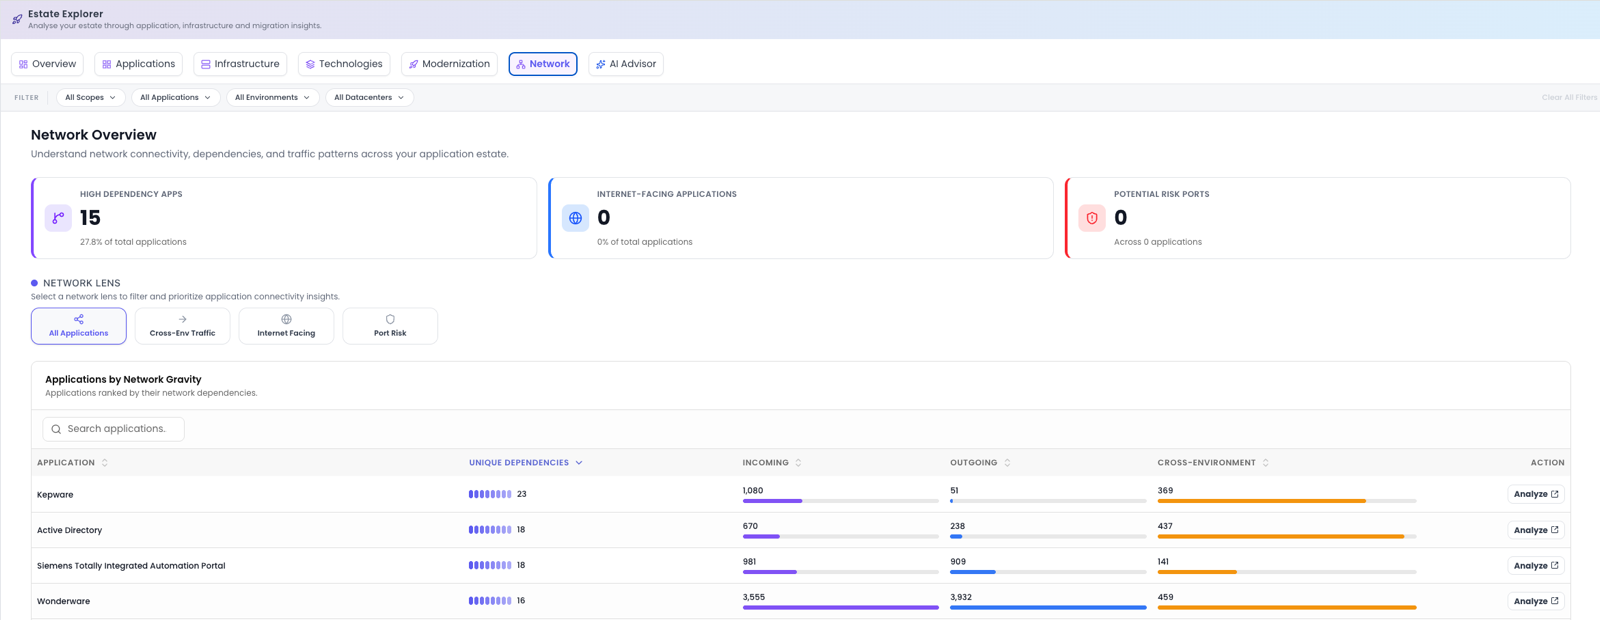
The central table ranks applications by network gravity (how much they pull on the rest of the estate), so you can see at a glance which applications anchor a wave and which can move freely. Its columns:
| Column | What it shows |
|---|---|
| Application | The application name. |
| Unique Dependencies | How many distinct applications it connects to. |
| Incoming | Inbound connections. |
| Outgoing | Outbound connections. |
| Cross-Environment | Connections that cross environment boundaries. |
| Action | Analyze: open this application's detailed dependency flows. |
This is an estate-level view: it ranks and compares applications so you can prioritise. When you click Analyze, you drop into that application's detailed dependency flows inside the Application Drawer's Networking tab, where the interactive dependency graph, flow tabs and per-connection detail live.
Why the roll-up matters
Raw network data is overwhelming: a mid-sized estate can have hundreds of thousands of server-to-server flows. Dr Migrate applies an intelligent roll-up that summarises those flows at the application level, and dynamic filtering that lets you expand only the detail you need. That's what makes dependencies actually usable for planning: you can reason about how applications relate, then drill down to the exact server-to-server connections (and export them, for example as firewall rules) only when you need them.
Use network gravity to sequence waves: tightly-coupled applications often belong together, and an application's cross-wave dependencies are a signal it may need to move sooner, or that its partners should follow.
Refreshing network data
When estate changes have been made since the network data was last refreshed (for example a server moved to a different application in Workload Mapping), an amber banner appears above the Network Lens strip. It reads Network data last refreshed with the date and time, and asks you to refresh. The same banner appears at the top of the Networking tab in the Application Drawer and the Server Drawer. No banner means the network views are up to date.
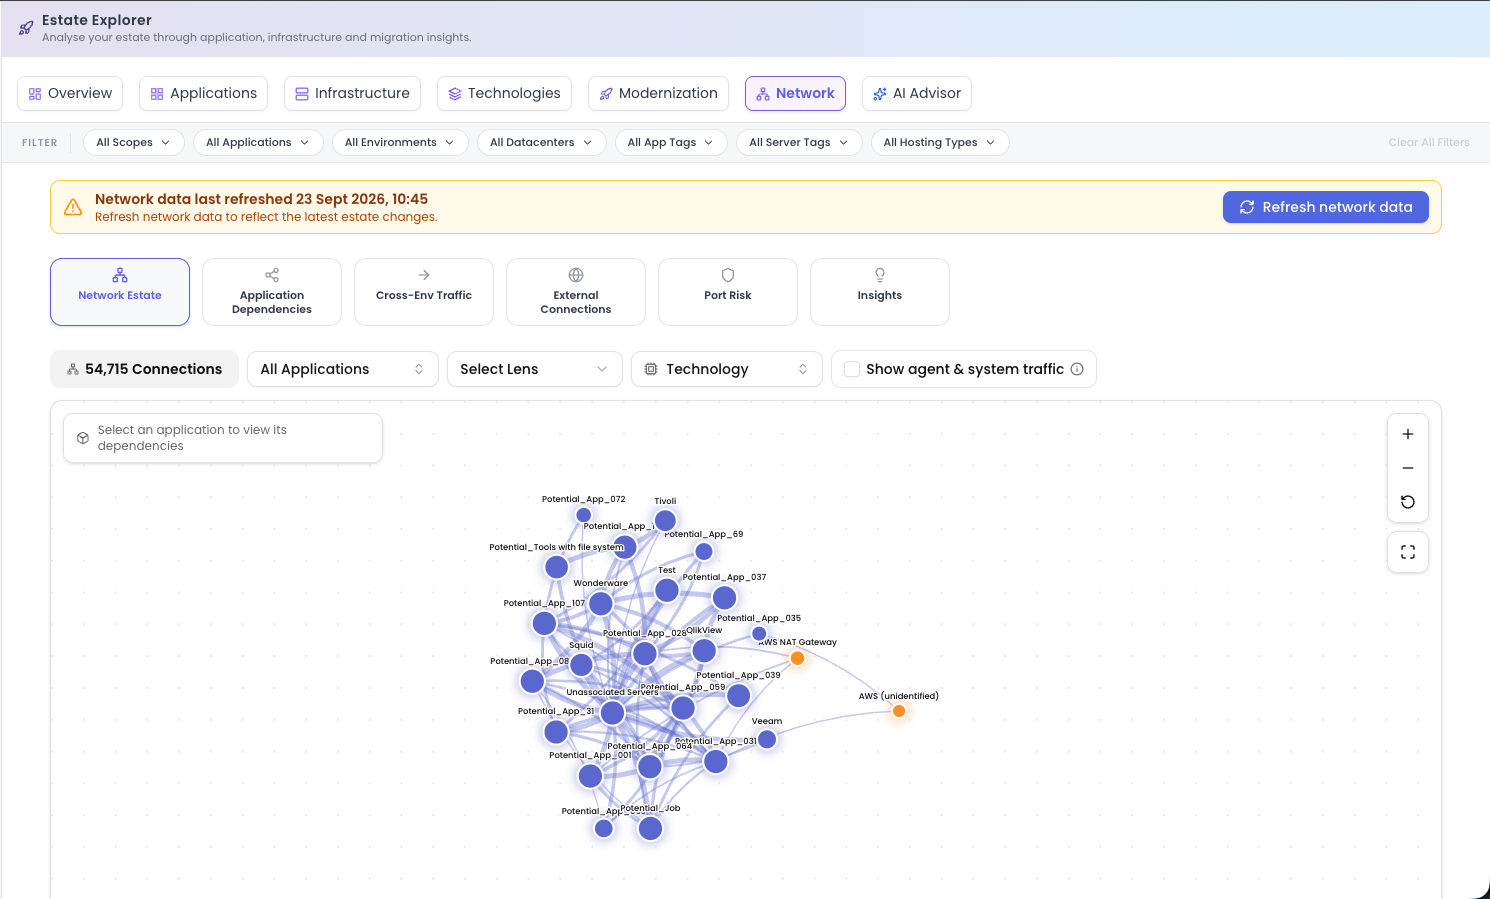
Click Refresh network data. The refresh takes a few seconds, then the view reloads and the banner disappears. If the banner reads Network data has not been prepared yet, click the same button once to prepare it.
If someone else is already refreshing, you see Refresh is already in progress and the banner clears when their refresh finishes. If the refresh fails, the banner stays and the network views keep showing the previous data: try again, or wait for the next data load, which refreshes the network data automatically.
Where to go next
To examine a single application's connectivity in depth, open it in the Application Portfolio and use its Networking tab. To turn dependencies into a sequenced plan, move to Plan → Migration Planning.